Along with being a Diamond level sponsor, Chronosphere gave two sessions at this year’s PromCon North America: “Sponsored Keynote: Aggregating, Alerting and Graphing on Millions of Prometheus Time Series” and “Streaming Recording Rules for Prometheus, Thanos & Cortex using M3 Coordinator”. The keynote session was given first by Rob Skillington, CTO and Co-founder at Chronosphere, which provided a lead-in to the second session by Rob and Gibbs Cullen, Developer Advocate at Chronosphere. The following is a recap of the topics and concepts covered during these sessions. To view the full session recordings, visit our PromCon North America event page.
Querying high cardinality metrics
Have you ever tried to view or query high cardinality latency data over a growing set of pods or containers? Have you sat around for minutes at a time waiting for these queries to run (and sometimes have them time out)? Great – so have we! But how did we get to this problem in the first place?
In Rob’s PromCon keynote, he paints a picture of a cloud native architecture where a single metric (e.g. HTTP or RPC latency) can lead to thirty million unique Prometheus time series (no wonder our queries are taking so long!). Sounds crazy, but let’s do the math: 50 services x 200 average pods per service x 20 average HTTP endpoints per service x 5 common status codes x 30 histogram buckets = 30 million series!
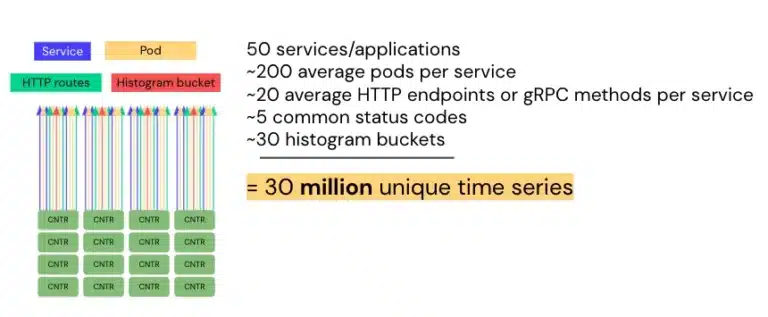
Breaking it down by inputs, you learn that this is actually within reason. But in most metrics monitoring use cases, you don’t need to view your metrics by a single time series or by pod. Instead, an aggregated view is sufficient for understanding the state of your applications, as well as for running faster, more efficient queries. For example, if you remove pod cardinality from the above metric example, the unique time series aggregates down to 150k metrics, which is much more manageable for query and longer term storage.
Reducing cardinality with aggregation via Prometheus Recording Rules
In the remainder of the keynote, Rob shares how you can use Prometheus recording rules to aggregate metrics to reduce cardinality and improve query performance. Recording rules are a powerful tool for Prometheus metrics, however, they can start to break down with large scale, high cardinality metrics. For example, you may receive a rule evaluation error from trying to load samples into memory past the instance’s query limits, and if you re-configure your Prometheus configuration to bypass these limits, you may then start to miss your rule evaluation intervals. Unfortunately, there are no out-of-the-box workarounds for these limitations at scale (i.e. 30 million time series). This approach can also lead to large resource consumption and query latency as you’re having to do all of this evaluation and re-evaluation in-memory over the network.
Streaming Prometheus aggregation with the M3 Coordinator
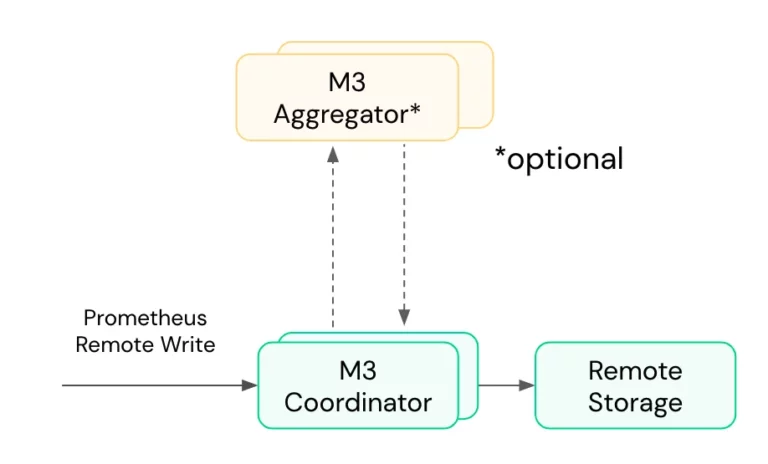
In the following breakout session, Gibbs joins Rob to continue the discussion by demonstrating how you can utilize M3 aggregation to help alleviate these pain points. Instead of recording rules, M3’s approach to aggregation uses roll-up rules which aggregate across multiple time series at regular intervals using the M3 coordinator and, in some use cases, the M3 aggregator (see the below diagrams). Before writing the newly aggregated series to M3DB or remote storage, the M3 coordinator will reconstitute the series as a counter, histogram, or gauge metric — all of which are compatible with PromQL.
Due to recent developments in Prometheus time series and M3, it is now possible to use the M3 ecosystem to perform in-memory streaming metrics aggregation without using M3DB itself. There are several benefits to using M3’s streaming metrics aggregation compared to regular Prometheus recording rules, which Rob and Gibbs share in the remainder of their presentation. While M3 aggregation via roll up rules does not completely replace recording rules, it does supplement them in four key ways:
- Save frequently on expensive steps with high cardinality reverse index query and read from storage.
- Scale aggregation independent of TSDB query resources.
- Spread aggregation of single individual rules over nodes.
- Use template aggregation rule to make life easier.
To see these benefits in action, check out the demos given at the end of the presentation in our full session recordings.
And that’s a wrap!
By the end of the two sessions, PromCon attendees had a better understanding of the limitations around regular Prometheus recording rules at large scale, and how M3 streaming aggregation via roll up rules can help relieve pressure on Prometheus (or other Prometheus remote storage solutions like Cortex and Thanos) when querying and alerting on metrics. We look forward to seeing you at PromCon in 2022!
Chronosphere is the only observability platform that puts you back in control by taming rampant data growth and cloud-native complexity, delivering increased business confidence. To learn more, visit https://chronosphere.io/ or request a demo.
Share This:
Table Of Contents
Most Recent:
Ready to see it in action?
Request a demo for an in depth walk through of the platform!