Are the Three Pillars of Observability Still Relevant?

Learn how to track logs, metrics, and traces throughout the three phases of observability and get insight into successful observability.

On: Apr 5, 2022
Rachel leads Product & Solution Marketing for Chronosphere. Previously, she built out product, technical, and channel marketing at CloudHealth (acquired by VMware). Prior to that she led product marketing for AWS and cloud-integrated storage at NetApp and also spent time as an analyst at Forrester Research covering resiliency, backup, and cloud. Outside of work, she tries to keep up with her young son and hyper-active dog, and when she has time, enjoys crafting and eating out at local restaurants in Boston.
What are the three pillars of observability?
What is the meaning of observability? For some, observability has been defined as a collection of distinct data types known as the three pillars—logs, metrics, and distributed traces. While these are all critical inputs to observability, they are not observability solutions in and of themselves. Rather than focusing on outcome, the siloed “three pillars of observability” approach to observability is overly focused on technical instrumentation and underlying data formats.
- Logs: How do logs fit into observability? Logs describe discrete events and transactions within a system. They consist of messages generated by your application over a precise period of time that can tell you a story about what’s happening.
- Metrics: Metrics consist of time-series data that describes a measurement of resource utilization or behavior. They are useful because they provide insights into the behavior and health of a system, especially when aggregated.
- Traces: What are traces in observability? Traces use unique IDs to track down individual requests as they hop from one service to another. They can show you how a request travels from one end to the other.
Although emitting all the data types in the three pillars of observability is important, these inputs alone can never guarantee better outcomes in cloud-native environments. For example, if a system emits logs, metrics, and distributed traces there is no guarantee that you will get notified about an issue in a timely manner, nor is there a guarantee you can triage issues quickly.
What’s more, many companies find little correlation between the amount of observability data produced and the value derived from this data. This is to say, more logs or metrics don’t equate to more value, even though they almost always equate to increased costs.
While the three pillars of observability outline important data functions, true outcome-based observability comes from zeroing in on the three phases of observability – referred to as “know, triage, and understand” – because teams are able to derive maximum value from their data on the way to rapid issue resolution.
The what and why of observability
Observability is both a practice (or process) and describes the property (or state) of a service. Like DevOps, observability is a core competency of distributed systems engineering. It is the practice that cloud-native developers do on a daily basis in increasingly complex systems. Observability is also a property of a system–whether or not it produces data that can be used to answer any question that a developer asks of it. It is much easier to maintain and manage an observable system than a non-observable one.
Rather than focus on observability in terms of the three pillars, engineering and SRE leaders in cloud-native environments should think about the three phases. Why? Because the three phases of observability do more to answer critical questions about operating the code and systems they’ve built. Also a property of newer systems, observability solutions produce data that answers developers’ questions in real or near-real time.
What challenges does observability address?
The need to introspect and understand systems and services is not new – many of the basic goals of observability have been in practice for decades. What’s changed, and where the three phases of observability come in, is driven by the fundamentally different nature of operating modern applications and infrastructure.
Cloud-native applications running on containers and microservices have a completely different architecture and are designed to be more scalable, reliable, and flexible than legacy apps. Cloud-hosted monitoring and application performance monitoring (APM) were born in a pre-cloud-native world – one that had very different underlying assumptions. Cloud-native has forced organizations to revisit how they perform monitoring and observility because:
- Data is growing in scale and cardinality. Cloud-native environments emit a massive amount of monitoring data — somewhere between 10x and 100x more than traditional VM-based environments.
- Systems are more flexible and ephemeral. Both the usage patterns and retention requirements are vastly different from what they were pre-cloud-native.
- Services and systems have greater interdependencies. Breaking services down into microservices leads to more complex dependencies that engineers must understand in order to troubleshoot problems. This also results in a greater need to correlate and connect infrastructure to applications to business metrics.
All of this has led to an explosion in complexity that makes it nearly impossible to reliably and efficiently operate cloud-native services without either dramatically increasing overhead, or finding a new approach. For example, the three phases of observability is an alternate approach to the “three pillars of observability” that is focused on the outcomes instead of the inputs.
Engineers lean into key operational questions
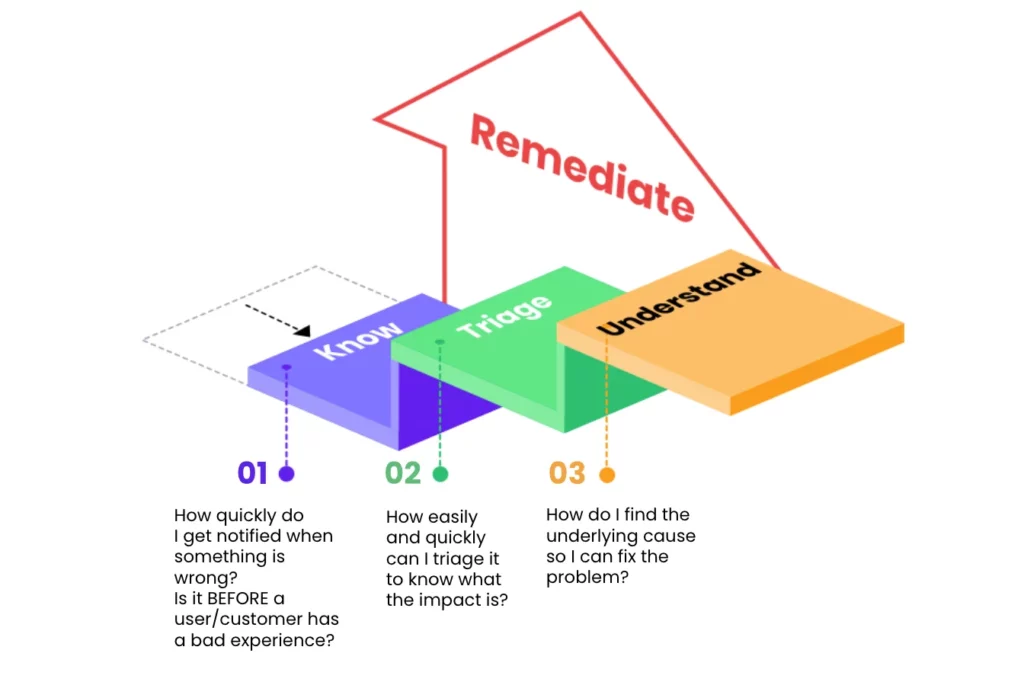
In practice, the three phases of observability (vs. the three pillars of observability) improve results by focusing engineers on must-needed answers to three key questions:
- How quickly—before or after a negative customer or employee experience—am I notified when there is a problem?
- How easily and quickly can I triage the problem and understand its impact?
- How do I find the underlying cause so I can fix the problem?
Better outcomes: The three phases of observability explained
The goal of each of the three phases of observability is to minimize negative impacts on customer or employee experience. DevOps teams do that by quickly finding the information they need to fix problems introduced in code fast—even before understanding a root cause. It’s important to note that remediation isn’t always the complete elimination of a challenge but rather the restoring of services to availability and performance levels that customers and employees have come to expect. Each phase maps to answering one of the three critical questions we believe is required to achieve great observability.
These are the three key phases (and tools required) to achieve great observability:
- Know: Recognize there’s a problem
You can’t fix an unknown problem. That’s why remediation starts with knowing there’s an issue in the first place—ideally before your customer does. Adding the technology (or observability solution) perspective, the fastest path to recognizing a problem is an actionable alert with correlated metrics, traces, and potentially even logs.
Companies such as Chronosphere offer an observability platform that focuses on the outcome—helping you find problems fast. For example, Chronosphere customers have reduced their time to detection by up to 3x and have advanced capabilities to ensure that every alert is actionable.
Introducing changes to a system is the largest source of production issues, so the ability to quickly connect the problem to the change is key. With a complete observability platform, team members can go straight from an alert to the remediation – often rolling back the latest deploy. Then they can perform root cause analysis without the ticking clock of customer expectations.
- Triage: Stop the problem from creating additional negative outcomes
Not all issues can be immediately remediated from the alert stage, many will have to go to triage. Triage is preliminary assessment of the scope of a problem, and indicates what is most important. This step is imperative because it helps to determine the urgency level for larger remediation efforts. Triage answers questions such as:
- How many customers are impacted and to what degree?
- Who is the best internal resource to help and are they available?
Observability platforms such as Chronosphere allow engineers to pivot the data and quickly shine a spotlight on contextualized data to diagnose issues. This involves directly linking to dashboards that show not only the source of the alert, but related and relevant contextual data. Moreover, engineers can rapidly manipulate the data to further isolate the problem using high cardinality pivots. That way, teams can quickly determine a best-course of action, which may be the difference between waking up a large team in the middle of the night to debug an issue, or waiting until the morning because the impact and severity is lower.
- Understand: Dive into the Root Cause of the Problem
After discovery and triaging of the problem, teams need to be able to shift quickly to finding out where and how the issue started to prevent it from happening again. Everyone can speculate, but correlated traces, logs, metrics and dashboards will give the data needed for a post-mortem to surface dependencies and what really went wrong at the most basic level.
Companies such as Chronosphere have an observability platform that gives engineers a direct line of sight into problem culprits by linking metrics and traces. Easy understanding of service dependencies comes from identifying the direct upstream and downstream dependencies of the service experiencing an active issue. Chronosphere is a single solution that lets teams efficiently navigate between traces and metrics to find trends and outliers so people can solve complex issues.
Additionally, Chronosphere’s observability platform provides insights by surfacing probable causes in alert notifications or during triage using dashboards to reduce time to root causes that can help fix underlying problems to eliminate the recurrence of incidents.
From knowing to triaging to understanding, teams that choose the Chronosphere platform benefit from observability simplified.
True outcome-based observability comes from zeroing in on the three phases of observability – know, triage, and understand.
A real-world example of observability’s three phases
When there is a major problem with a system at work, it can feel very much like everything is on fire. That’s why a house fire comparison is a good one for explaining why teams need to be focused on the three phases of observability. In this example, people paying attention to outcomes first speed the way to remediation:
- Know – Most people live in houses equipped with fire detection and remediation systems—smoke detectors, fire extinguishers, etc.—but few people actually expect a fire to break out in the building. When it does, people need an alert as fast as possible. Whether it’s a fire alarm, smoke, or flames, the faster people are aware there is a problem, the sooner they can take action.
- Triage – In the heat of the moment, people quickly assess the scope. Is it contained in one room or spreading between floors? Will putting it out be a one-person or fire-department job? As this assessment is taking place, one or many individuals are typically already moving in to remediate as best as they can—spraying a household extinguisher, calling 9-1-1, and the like. Although they may be wondering where it started, they push that thought away to focus on the task at hand, which is putting the fire out.
- Understand – Once the fire is extinguished, really diving into what happened (with firefighters or others in the house) starts in earnest. How did this happen? How do the homeowners ensure it never happens again? These critical questions into root-cause are best explored after remediating the problem. Moreover, there’s typically less finger-pointing and more constructive resolution among people when the crisis is over.
Teams deserve more than the three pillars of observability
In all cases—whether a service has gone down or a fire is engulfing a garage—the primary goal is to get from the problem-starting to problem-resolution as quickly as possible. The technical inputs, or three pillars of observability, are helpful enablement tools but they don’t improve outcomes. Boost your outcome success with the three phases of observability, considering first the steps of know > triage > understand.
Great observability can lead to competitive advantage, world-class customer experiences, faster innovation, and happier developers. But organizations can’t achieve great observability by just focusing on the input and data (three pillars of observability). By focusing on the three phases and the outcomes outlined here, teams can achieve the promise of great observability.
Share This:
Table Of Contents
Most Recent:
Ready to see it in action?
Request a demo for an in depth walk through of the platform!