How Chronosphere’s control plane helps users manage metrics at scale

How Chronosphere handles some of the issues of managing metrics at scale compared to other solutions.

On: Apr 12, 2022
Common problems in metrics at scale
We’ve written a couple of posts in the past that touch on some of the ways that Chronosphere can help companies take control of their observability solutions and prevent the cost of observability from growing faster than the cost of the systems being monitored. Even though Chronosphere’s control plane is a core part of the value that we provide to our customers, a lot of the benefits it provides can seem invisible to users. In this post we’ll try to highlight some of the work our team has done here, and contrast how Chronosphere handles some of the issues of managing metrics at scale compared to other solutions.
There are two problems related to operating a metrics solution at scale that everyone has to address in some way:
- How can we stay on top of our ingestion load, and what happens when there is a large surge in metric cardinality/writes?
- How can we limit the impact of expensive queries on the system and users, and what happens if there is a sudden surge in read traffic?
These are pretty straightforward questions related to how any system behaves under load, but addressing them in a robust way can be a challenge. With most metrics solutions available, the answer to both of these questions tends to be “spend more money to handle additional traffic”, or even worse, “do nothing”, which usually means the system ends up falling over(!).
In the case of Chronosphere, our goal is to ensure that “spend more money” is always a conscious, deliberate decision of our customers. To achieve that goal we give our users a number of tools to help them gain visibility into how the system is being used, as well as control over how it behaves when it reaches its limits. Let’s look at how we answer both of the above questions in more detail.
Taming rampant metric growth
When it comes to handling metric growth, the first thing we need to do is understand how much data we have, and where it is coming from. Within Chronosphere, users have tools like the Metrics Analyzer to help them understand their metric data in real-time, and filter/group by any metric labels to understand what the biggest contributors to write traffic are.
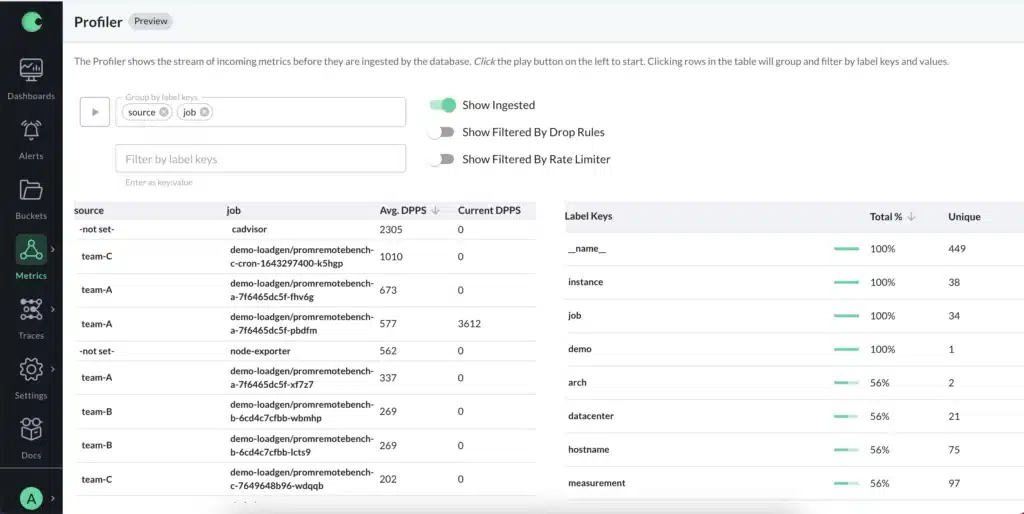
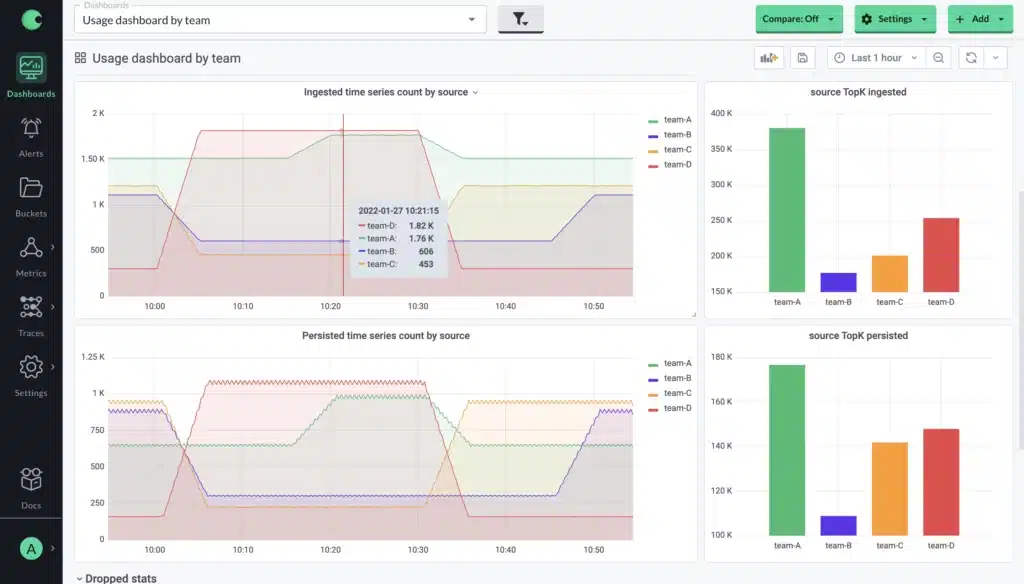
In addition to this fine-grained view, users also have access to usage metrics, which show trending changes in metric volume and can be optionally broken down by any common label among their metrics – for example showing volume broken down by different teams in the organization. Because these are prometheus metrics, it is possible to create alerts based on them to notify a team when their usage spikes unexpectedly.
Being able to know about unexpected metric growth and where it is coming from is one thing, but what does it look like when it actually happens? From a general perspective, there are 3 options for a metrics system when the amount of incoming metric data reaches the upper-limit of what it can handle:
- Do nothing (at which point the system will fall over or become unusable)
- Allocate additional resources to handle the additional load (“throw more money at it”)
- Implement a load-shedding/rate-limiting strategy to allow operation to continue without consuming additional resources
Option 1 is clearly a non-starter for any critical service, and as we said at the beginning, with Chronosphere we want additional spend to always be a conscious action for our customers. This means option 2 is out of the question as well.
We find that Option 3, load-shedding/rate-limiting, is the best approach – if there is a sudden spike in incoming metrics, Chronosphere will allow what it can and drop any additional data beyond that. However, Chronosphere customers are also able to influence rate-limiting with two controls:
- Drop rules: Drop Rules allow customers to avoid ingesting any data that matches a given filter. Drop Rules can be:
- Always active, in the case of metrics that are being collected that we simply do not want to keep.
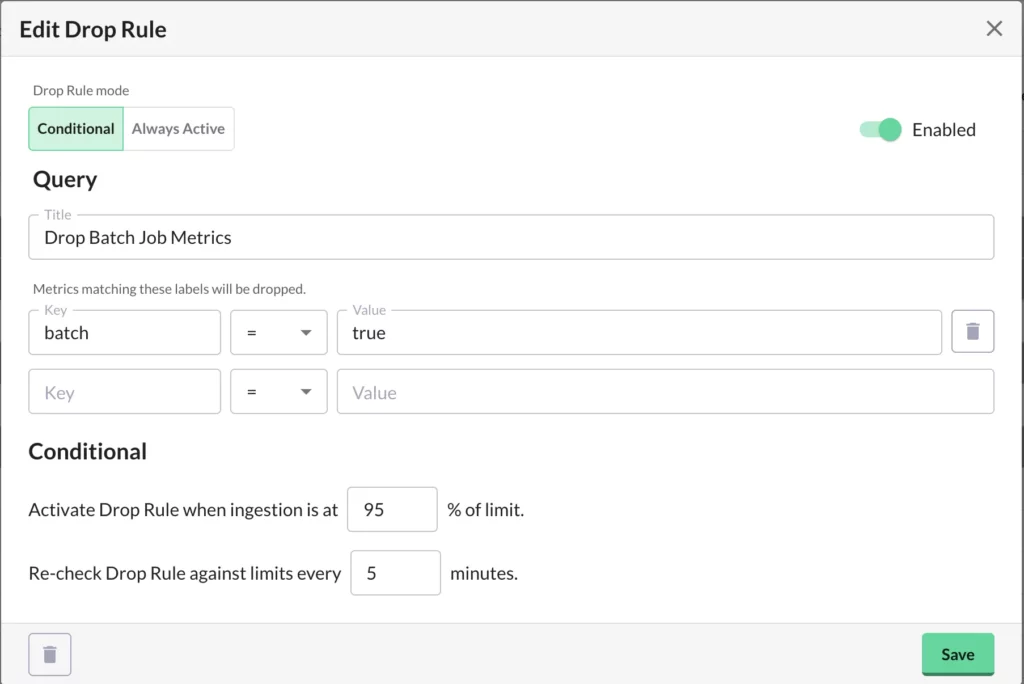
- Conditional, to shed load when we’re getting too close to our limits. For example, you can implement a conditional policy that will start dropping nonessential metrics (such as from a batch job) when more than 95% of the platform’s capacity is being used, to avoid hitting your limit:
- Rollup rules: In addition to Drop Rules, customers can also leverage Rollup rules, which allow them to persist less data than they send to Chronosphere by aggregating it beforehand. Not only does this allow our customers to do more with less capacity, it also cuts down on how quickly they need to add capacity over time. For example, if you have a Rollup rule that aggregates metrics for a service as a whole, and drops the original per-pod metrics, you won’t add capacity when more pods are added.
Altogether, the controls available to customers provide multiple options to help manage the amount of metric data they are paying to keep, and eliminate the need to worry about surprise overages. In comparison, most other solutions available take the approach of autoscaling to accommodate additional load. That’s not necessarily a problem on its own, but it makes having appropriate tooling to identify and remediate load spikes even more important – otherwise, it’s far too easy for a minor change to unexpectedly cause a massive increase in how much you are paying for your metrics.
Data availability and avoiding noisy neighbors
So far we’ve talked about how Chronosphere deals with unexpected increases in write traffic, but what about how we handle read traffic? Making sure metrics can be queried effectively, and ensuring that individual user experience does not suffer is just as important as guaranteeing writes – after all, what use is it to store metric data if you can’t look at it? Not only does this apply to user-driven queries to load dashboards or explore metrics, but also to automated queries such as those that power alerts when there is a problem; it’s critical that we guarantee that these queries cannot be interrupted by sudden changes in the workload.
One thing worth noting is that because Chronosphere provides a dedicated tenant for each of our customers, we do not have the traditional issue of “noisy neighbors”, where one customer’s surge in demand can affect all of the others that share resources with it. This allows Chronosphere to focus on handling the needs within individual customer tenants.
When dealing with read traffic, there’s a couple of things we want to be able to protect against:
- It should not be possible for a given user to generate a large amount of query work that monopolizes the resources of the system and prevents other users from issuing their queries.
- We need to ensure that the system cannot be overloaded by query work, whether from a single user or from many concurrent users.
Just like the conversation around handling write traffic, there’s a couple of options available to us to handle sudden surges in read traffic. The same list as before, actually:
- Do nothing (at which point the system will fall over or become unusable)
- Allocate additional resources to handle the additional load (“throw more money at it”)
- Implement a load-shedding/rate-limiting strategy to allow operation to continue without consuming additional resources
Since we are looking at the same list of options, the same overall trade-offs apply as well:
- Doing nothing is not an option for us.
- We don’t want to automatically increase capacity (and therefore costs) for our customers, either.
So how do we rate-limit reads in a way that does not unfairly impact users, and protects system queries like alerts from being impacted by user load? To handle this, Chronosphere has a query scheduler that ensures that query resources are fairly shared by users – this is implemented at the storage level, so if a user issues an expensive query or a large volume of smaller queries, the database will break the work into chunks that are scheduled alongside work for other user/system queries.
The net effect is that if a single user generates a lot of read work all at once, their queries may take longer, but other users will not be unfairly penalized, and the system’s ability to evaluate alerts will not be disrupted. If the system as a whole is highly loaded, then delays are introduced across the user base proportional to the amount of read work that each user is generating.
In addition to our query scheduler that ensures one user cannot prevent other users from running queries, we also have a fairly sophisticated query cache that helps to minimize the amount of work we actually have to do for a given query, with support for features like partial cache hits, and de-duplicating requests to the datastore for uncached data.
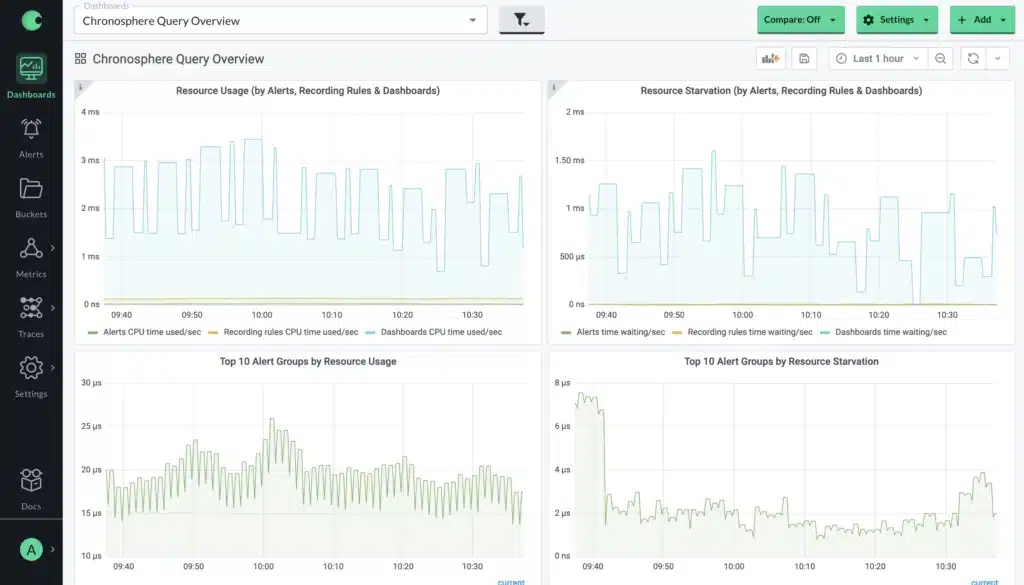
Since there is a limit on how much query capacity is available to be used, we want to ensure that our customers are able to see how much they are using and when they’re running into situations where the query scheduler is introducing delays into queries, so we provide metrics and a pre-built dashboard to help here, just as we do with metrics ingest:
But what can a customer do if they see that they are frequently running into limits here? Once again, we can leverage Rollup rules to help! Where we see queries being issued that fetch a lot of series but return relatively few, we can create a rollup that will pre-compute the aggregated series and fetch that instead, making a query significantly cheaper. If you are familiar with Prometheus Recording rules this may sound familiar, but the key difference is that Rollup rules are applied at ingest time.
This means that from a query capacity perspective, creating new rollups is free for users, but a recording rule would still be using capacity in the background! That might even make things worse, if for example you are trying to speed up a dashboard that is only used sporadically.
Of course, if clients need more read capacity they also have the option to pay to expand what is available – in practice we haven’t seen this happen though, since writes significantly outweigh reads, and the application of Rollup rules makes most expensive query operations orders of magnitude cheaper.
Conclusion
At Chronosphere, we believe that predictable behavior and control over metrics is a fundamental part of the service that we provide to our customers, and something that is required as organizations continue to grow and scale. If managing metrics at scale is a problem for you today and you’d like to learn more about our solution, contact us and we’ll be happy to share more about how we can help!
Share This:
Table Of Contents
Most Recent:
Ready to see it in action?
Request a demo for an in depth walk through of the platform!