


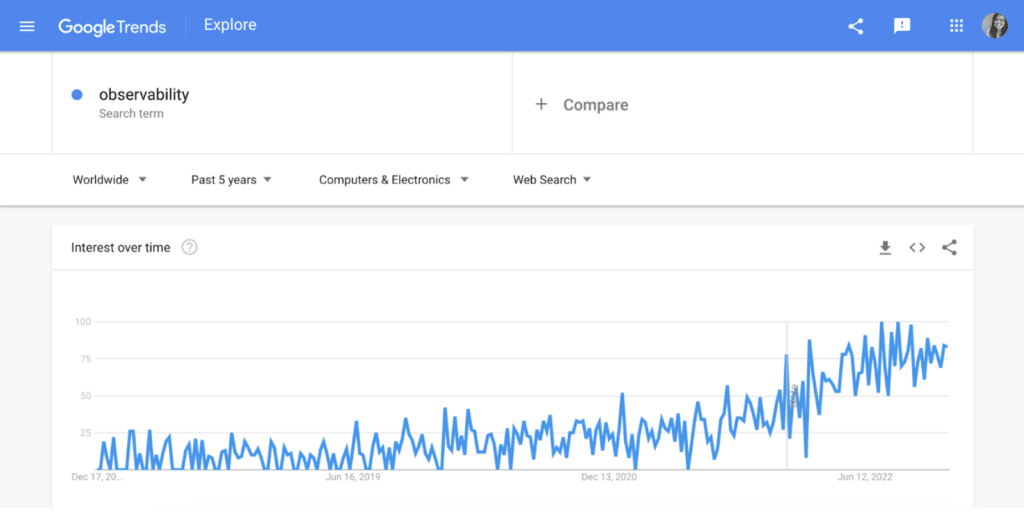
Google searches for “observability” surged last year and anyone seeking approachable introductions had to scroll past pages of adverts disguised as articles and rehashings of the same dry academic definitions.
Despite the glut of content, if you are still confused about what exactly observability is, you’d be in good company. A whopping 48% of organizations surveyed by DEJ reported market confusion about the term! For an industry term that has been prominent for six years now, it’s wild that we are still having 101-level discussions about definitions.
If you’re reading this, I assume you have some idea about what observability means, so we can skip the part where I present my own definition and a history lesson about the horrible days of digging into logs and wrangling metrics before pitching you on “The One True Definition of Observability.”
Let’s start with the most common misconception, “observability is monitoring rebranded.”
Observability is monitoring rebranded
Noooope. Observability and monitoring are distinct but complementary concepts.
Consider a kitchen with a smoke detector that is sounding the alarm.
A traditional detector uses a beam of light and after a certain amount of particles have blocked or dampened the light, an alarm is triggered. Newer detectors that are a part of a smart home system use two light beams, early warning notifications, context about which room the triggered detector is in — aka where the problem was detected — and incorporate video cameras to provide a live visual of the room.
The smoke detector itself is the monitor and the internal loop of sensing and checking if a certain threshold is met is the act of monitoring.
Observing involves an observer, a human responder to the smoke alarm and senses like touch, sight and sound to answer “Why is the smoke detector firing? Is it a real emergency?” Observability is the extent to which a responder can answer those questions using available data from the detector and their own senses and experiences.
It could be that your roommate just burned a pot of pasta on the stove and the hood vent is underpowered. You could discover that you’ve got dust bunnies and enough buildup on the detector that dust, not smoke particles, triggered it. Or perhaps it is a valid early warning call to replace the batteries.
Relying on the traditional detector means more work for the human to go into the room and assess the situation, knowing only that the detector is firing and relying on their available senses of sight, sound and touch to make sense of things. Compare that to a newer smart detector that provides details like the room the triggered detector is in and a live video feed.
Observability is the degree to which an observer can take in information and ask questions to understand what is happening. Think about which system would help you answer, “Why is the fire alarm going off?” more efficiently — the traditional or modern detector? The clear winner is the modern detector that provides contextual information upfront. That is a system with greater observability. Traditional detectors have low observability. They rely on human ears to follow the beeps to locate the room and then eyes to see if anything caught on fire. That’s a lot of action to take to narrow down where and what the problem is!
Today both traditional and smart smoke detectors play a key role in building safety, together with human occupants. If humans weren’t an important piece, we’d immediately dispatch firefighters when detectors went off. And similarly we need detectors in place to continually monitor because humans aren’t capable of being on perma-alert. It is not monitoring versus observability, but monitoring and observability.
Together, monitoring and observability provide a holistic view of your system that supports the human operator in the loop with rich system information for effective troubleshooting.
Status quo is working just fine
My first thought is “working fine for who exactly?”
The way we design, architect, build and deliver software in the enterprise radically shifted in the move to microservices, containers and the cloud — what’s coined as “cloud-native”. A Digital Enterprise Journal survey reported that 58% of organizations lost visibility in the path from pull request to production after modernization projects.
Observability is the next investment to make and senior leaders in particular need to have their “aha!” moment since 0% surveyed in the 2023 Cloud Native Observability report had any complaints about their current observability solution. A stunning 100% of individual contributors harbored complaints.
Let’s say an alert fires, paging an engineer because of an increased error rate on a particular service and they’re working in a cloud native shop. The application is likely running in a container on a virtual machine on a cloud server with configuration split across multiple Kubernetes objects possibly operating in different regions. That’s a lot of potential culprits! The engineer needs to quickly understand:
- How bad is the issue? Is it visible and customer facing?
- Is this relegated to one instance of the application or across multiple?
- Was there a code, config or infrastructure change?
- If yes, then what/who was involved?
- Is it an issue at the infrastructure layer — bad host, noisy neighbor, regional outage, etc.?
- What does normal look like?
- How many users/accounts are experiencing this?
Vow to make 2023 the year you close that gap by listening to those on call and digging in beyond shallow incident metrics like mean time to repair (MTTR) to understand why and how increasing observability could benefit your organization.
Observability is traces, logs, and metrics
Traces, logs and metrics are types of signals that your system can emit and considering them to be the foundation of observability falls out of the “Three Pillars.”
To be precise, observability is a system trait, a descriptor, an adjective, not a telemetry checklist, and the boundaries between the data types are fuzzier than you may realize. A log could be classified as an event if it’s structured, or a span if it had start and end timestamps and trace and parent IDs. Metrics can be emitted from source or derived from a log, trace or events.
If you started on day one with a service that emitted nothing and then added logging, you would not be 33.3333% of the way to “achieving observability.” Consider where the data is being sent, how it’s being accessed, and who is looking at it.
Still skeptical? Ponder the following: Is each type sent to different tools with their own UI, query language, charting libraries? Is there onboarding and training specific to engineers at each part of the stack? How consistent is metadata and tags between the data types? Finally, are your engineers regularly using telemetry to inform each stage of the software life cycle?
Knowing the answer to these questions and how each data type falls into your observability strategy is key to making the most out of your data and making sure the right data gets onto the right dashboards.
Observability is too expensive
Chronosphere is the third observability company I have worked for, which means I am used to hearing “We could never afford a hosted vendor solution, that’s why we run an observability stack in-house”.
On the surface running your own in-house stack can seem like a cheaper, less involved option. Factoring hidden costs of hiring and managing an SRE team to operate the platform, increased cost of isolated infrastructure and developing enablement and training
Which gets me thinking about the massive lift it takes to operate and scale a highly available real-time monitoring and observability platform. Taking into account the money spent to hire, train and retain site reliability engineers to maintain the in-house system plus having to create training and enablement from scratch, there are a lot of hidden costs to building and operating your own observability stack.
Another consideration is the vendor itself; when did their messaging shift to observability? Did they start as a traditional monitoring company? Are you locked into a massive bill because of proprietary instrumentation?
In a cloud native environment, the sheer amount of telemetry generated is overwhelming and duplicating data can be one factor contributing to a sky-high bill. Eric Mustin put it best in his “Notes on Vendor Neutral Observability”
“If users are collecting the same error and stack trace via a span event, a RED metric, a log, and an error tracking Event, they should expect to be billed for it 4 different times. It’s up to them to take the time and curate the amount of data they emit and how they emit it.”
In terms of the cost of observability, it’s important to factor both the concrete costs of data access and storage with the hidden costs of staffing a team to operate an in-house stack.
Conclusion
All right so we’ve got full agreement?
Observability is how well someone can understand their system by using signals generated by instrumentation.
Observability is not monitoring and engineers are feeling the pain of status quo implementations. More than the telemetry you emit and even the tooling you use, it is about including and empowering the human operator in the loop and a holistic telemetry strategy that can combat the high cost of telemetry at scale.
Now that we’ve settled that, let’s tackle platform engineering next.


