Distributed Application Observability
Chronosphere’s integrated, developer-centric platform offers unparalleled insights into your microservices and cloud native apps. Seamlessly navigate, understand, and optimize your services with real-time, context-rich data analysis and visualization.
Detect and resolve issues faster, enhance application performance, and collaborate more effectively to deliver the best customer experience possible.
How It Works
Service-Oriented, Developer Centric Tooling
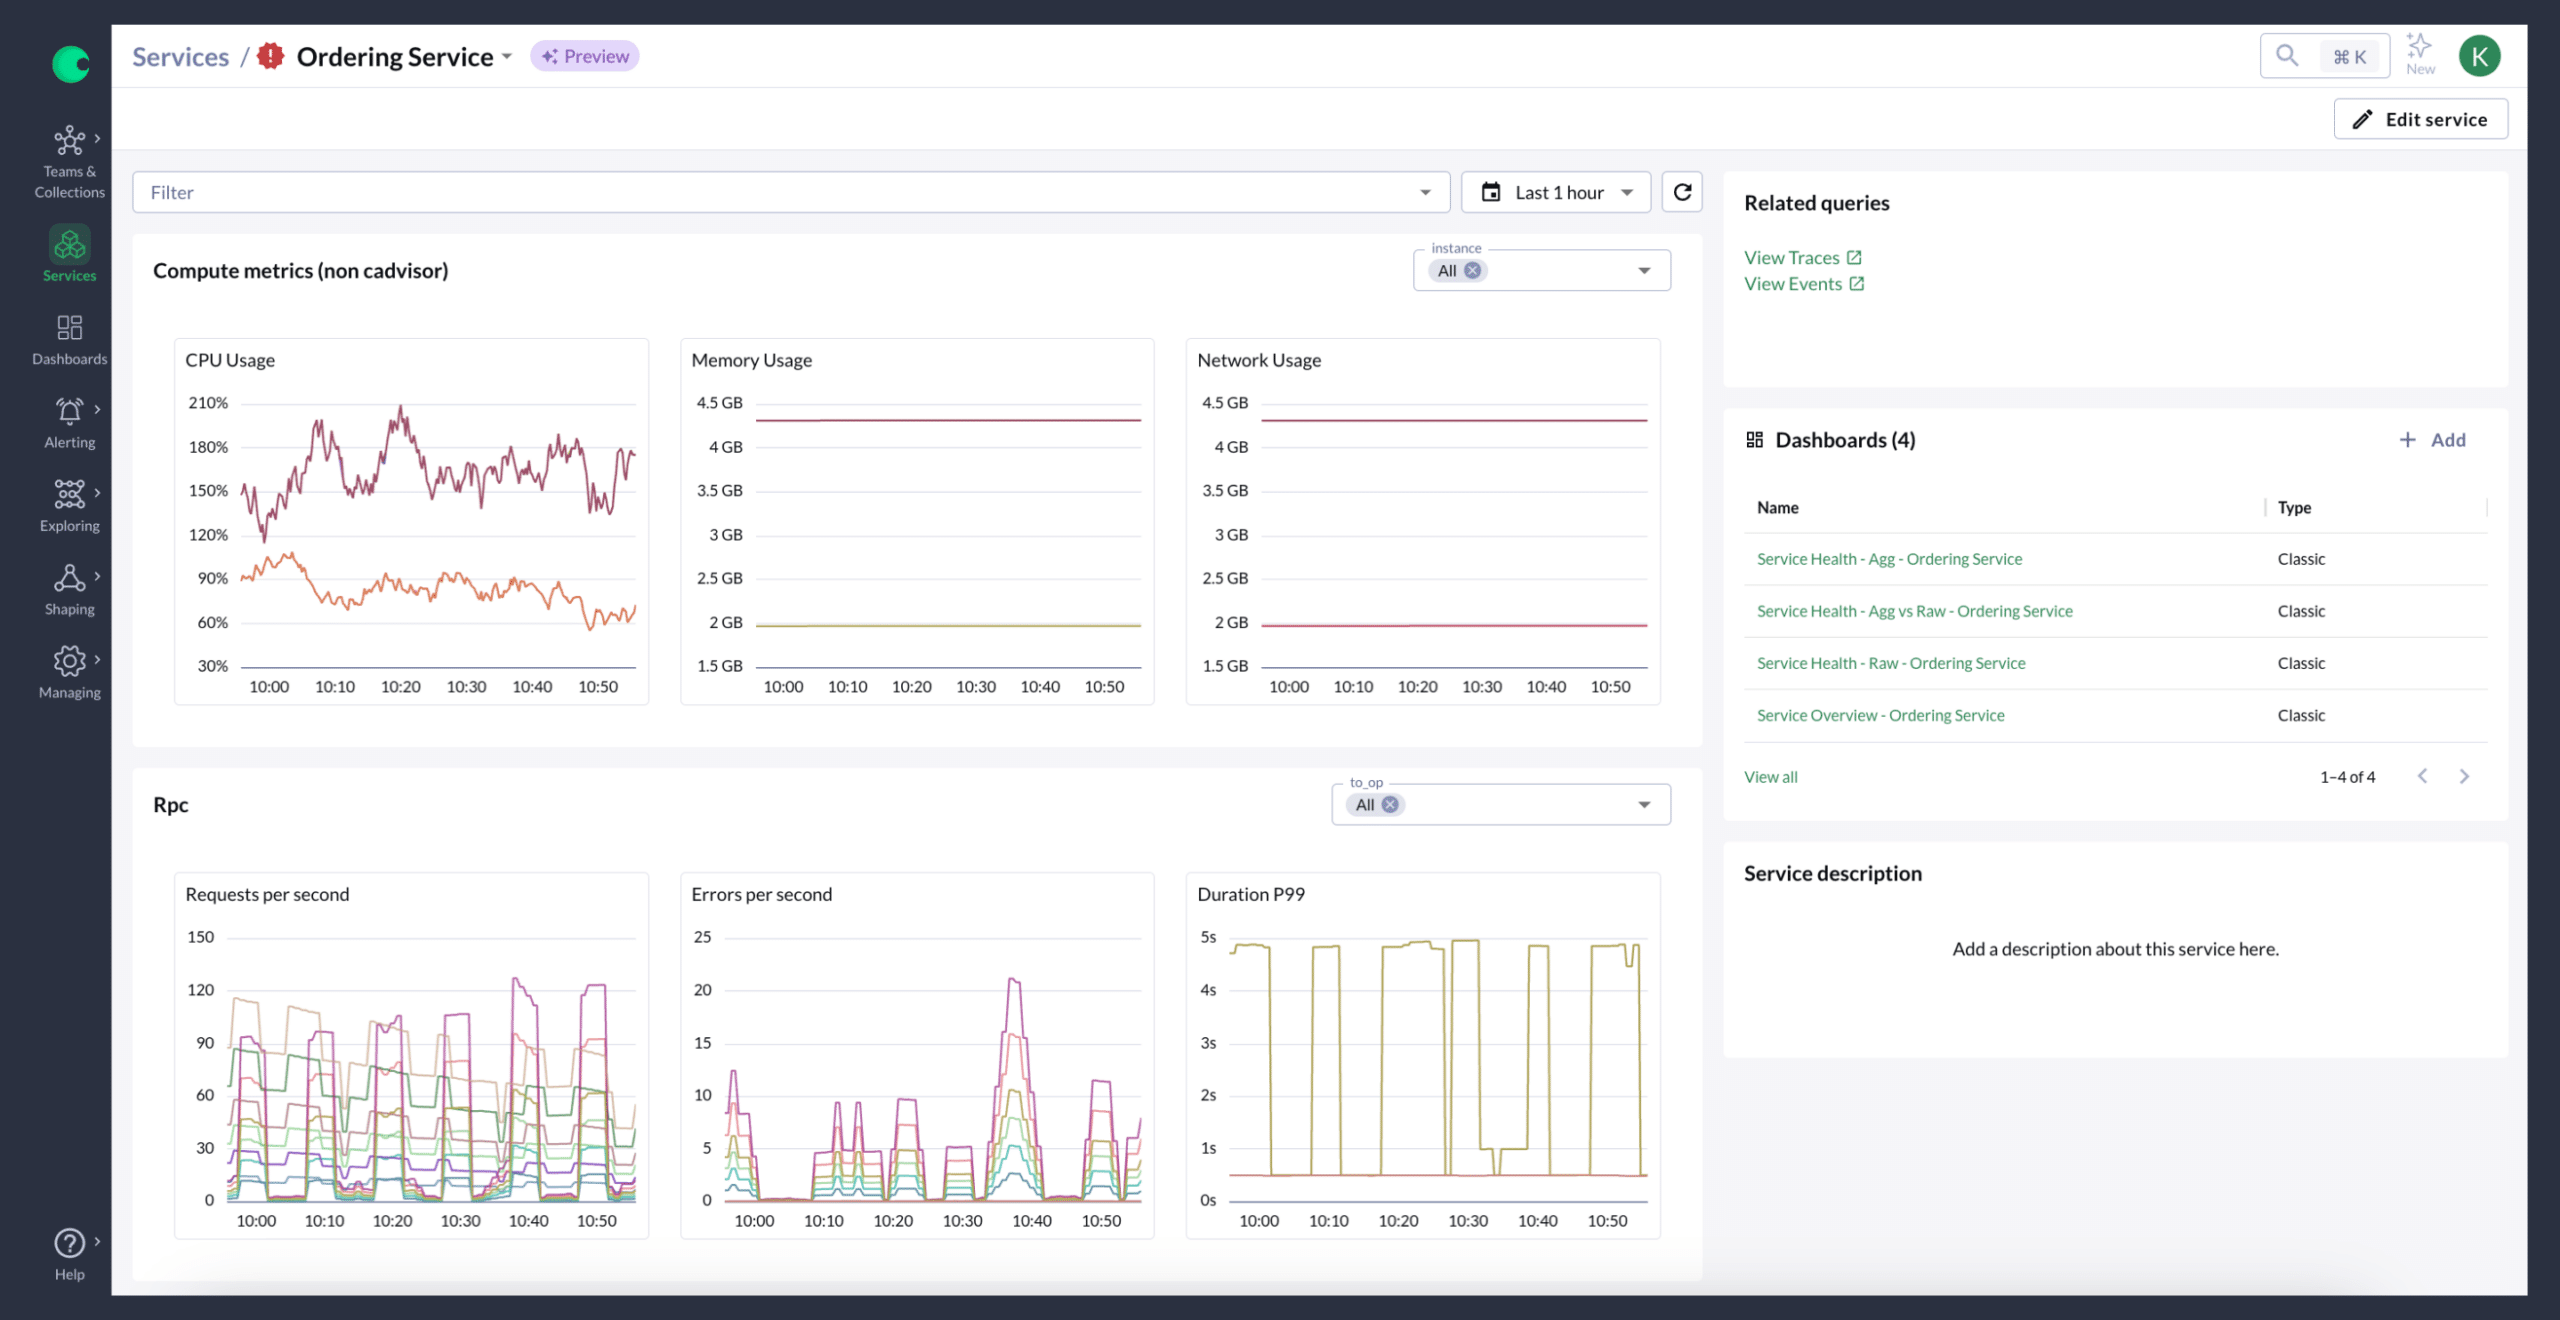
Unlock the full potential of your cloud native environment with Chronosphere Lens
- Dive deep into the health and performance of apps with dynamically generated service-centric views, which intuitively align with your application architecture.
- Effortlessly utilize RED metrics and SLOs to optimize service performance, empowering you to manage and visualize the interdependencies of your services, enabling precise and efficient system troubleshooting and navigation.
Seamlessly Correlate All Telemetry Data In Context
Seamlessly correlate your telemetry data - metrics, logs, traces, and events - all within context
- Change Event Tracking adds another dimension, allowing you to directly link system changes to performance impacts.
- Get a comprehensive, real-time view of your system, which is essential for rapid issue resolution.
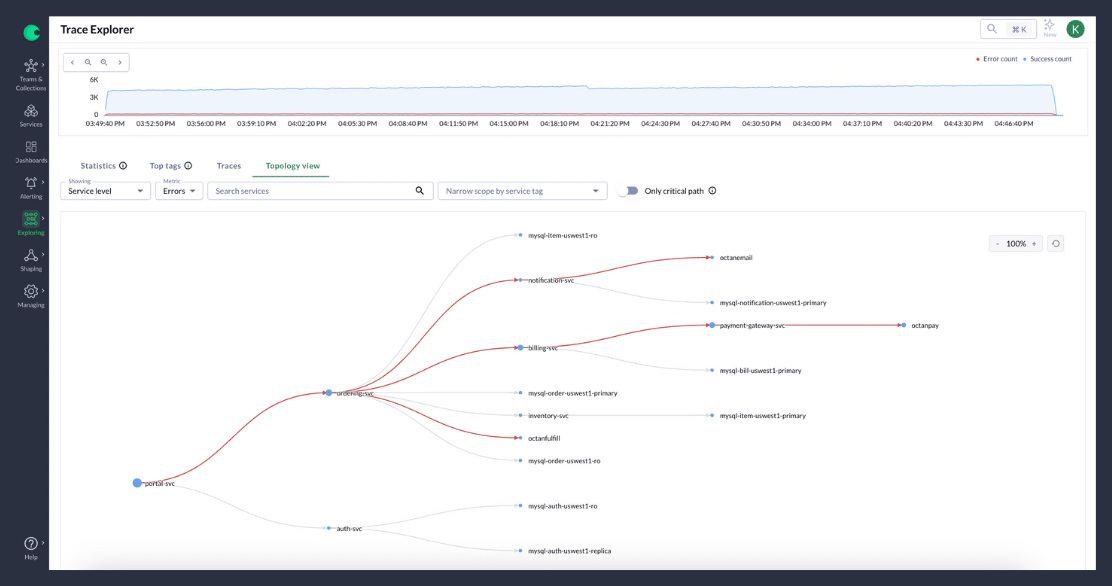
Enhanced Insight With Distributed Tracing
Master the complexities of your microservices architecture
- Provides an in-depth view of request paths, enabling you to trace interactions across your system's multiple components.
- Identify latency issues and optimize inter-service communications, offering critical insights into the performance and health of your distributed applications.
Key Benefits
Rapid issue identification and resolution
Quickly pinpoint and resolve issues with Chronosphere's integrated observability platform. Service-oriented views and context-rich data correlations lead to faster diagnosis, significantly reducing downtime.

Increased confidence in code releases
Gain confidence in deploying new code with real-time insights and comprehensive tracing capabilities. Chronosphere provides a clear understanding of how new changes impact system performance and stability.

Boost developer productivity
Enhance developer productivity with tools that align with their workflows. Chronosphere's service-oriented interface and actionable insights enable developers to focus more on innovation and less on troubleshooting.

Optimize costs with dynamic trace sampling
Leverage Chronosphere's dynamic trace sampling to balance cost and insight. This ensures you capture vital data without incurring unnecessary expenses, optimizing your observability spending.

Request a Demo
Whether you are struggling to scale Prometheus or are frustrated with the high cost and low value of your monitoring SaaS, our team is ready to give you a custom demo and walk you through our observability platform.