Cloud Native Infrastructure Observability at Scale
Chronosphere offers complete visibility into the health and performance of your Kubernetes clusters to ensure peak performance and reliability, regardless of scale.

Deep coverage of your modern stack
Chronosphere excels in cloud-native environments, seamlessly adapting to dynamic workloads and ephemeral resources.
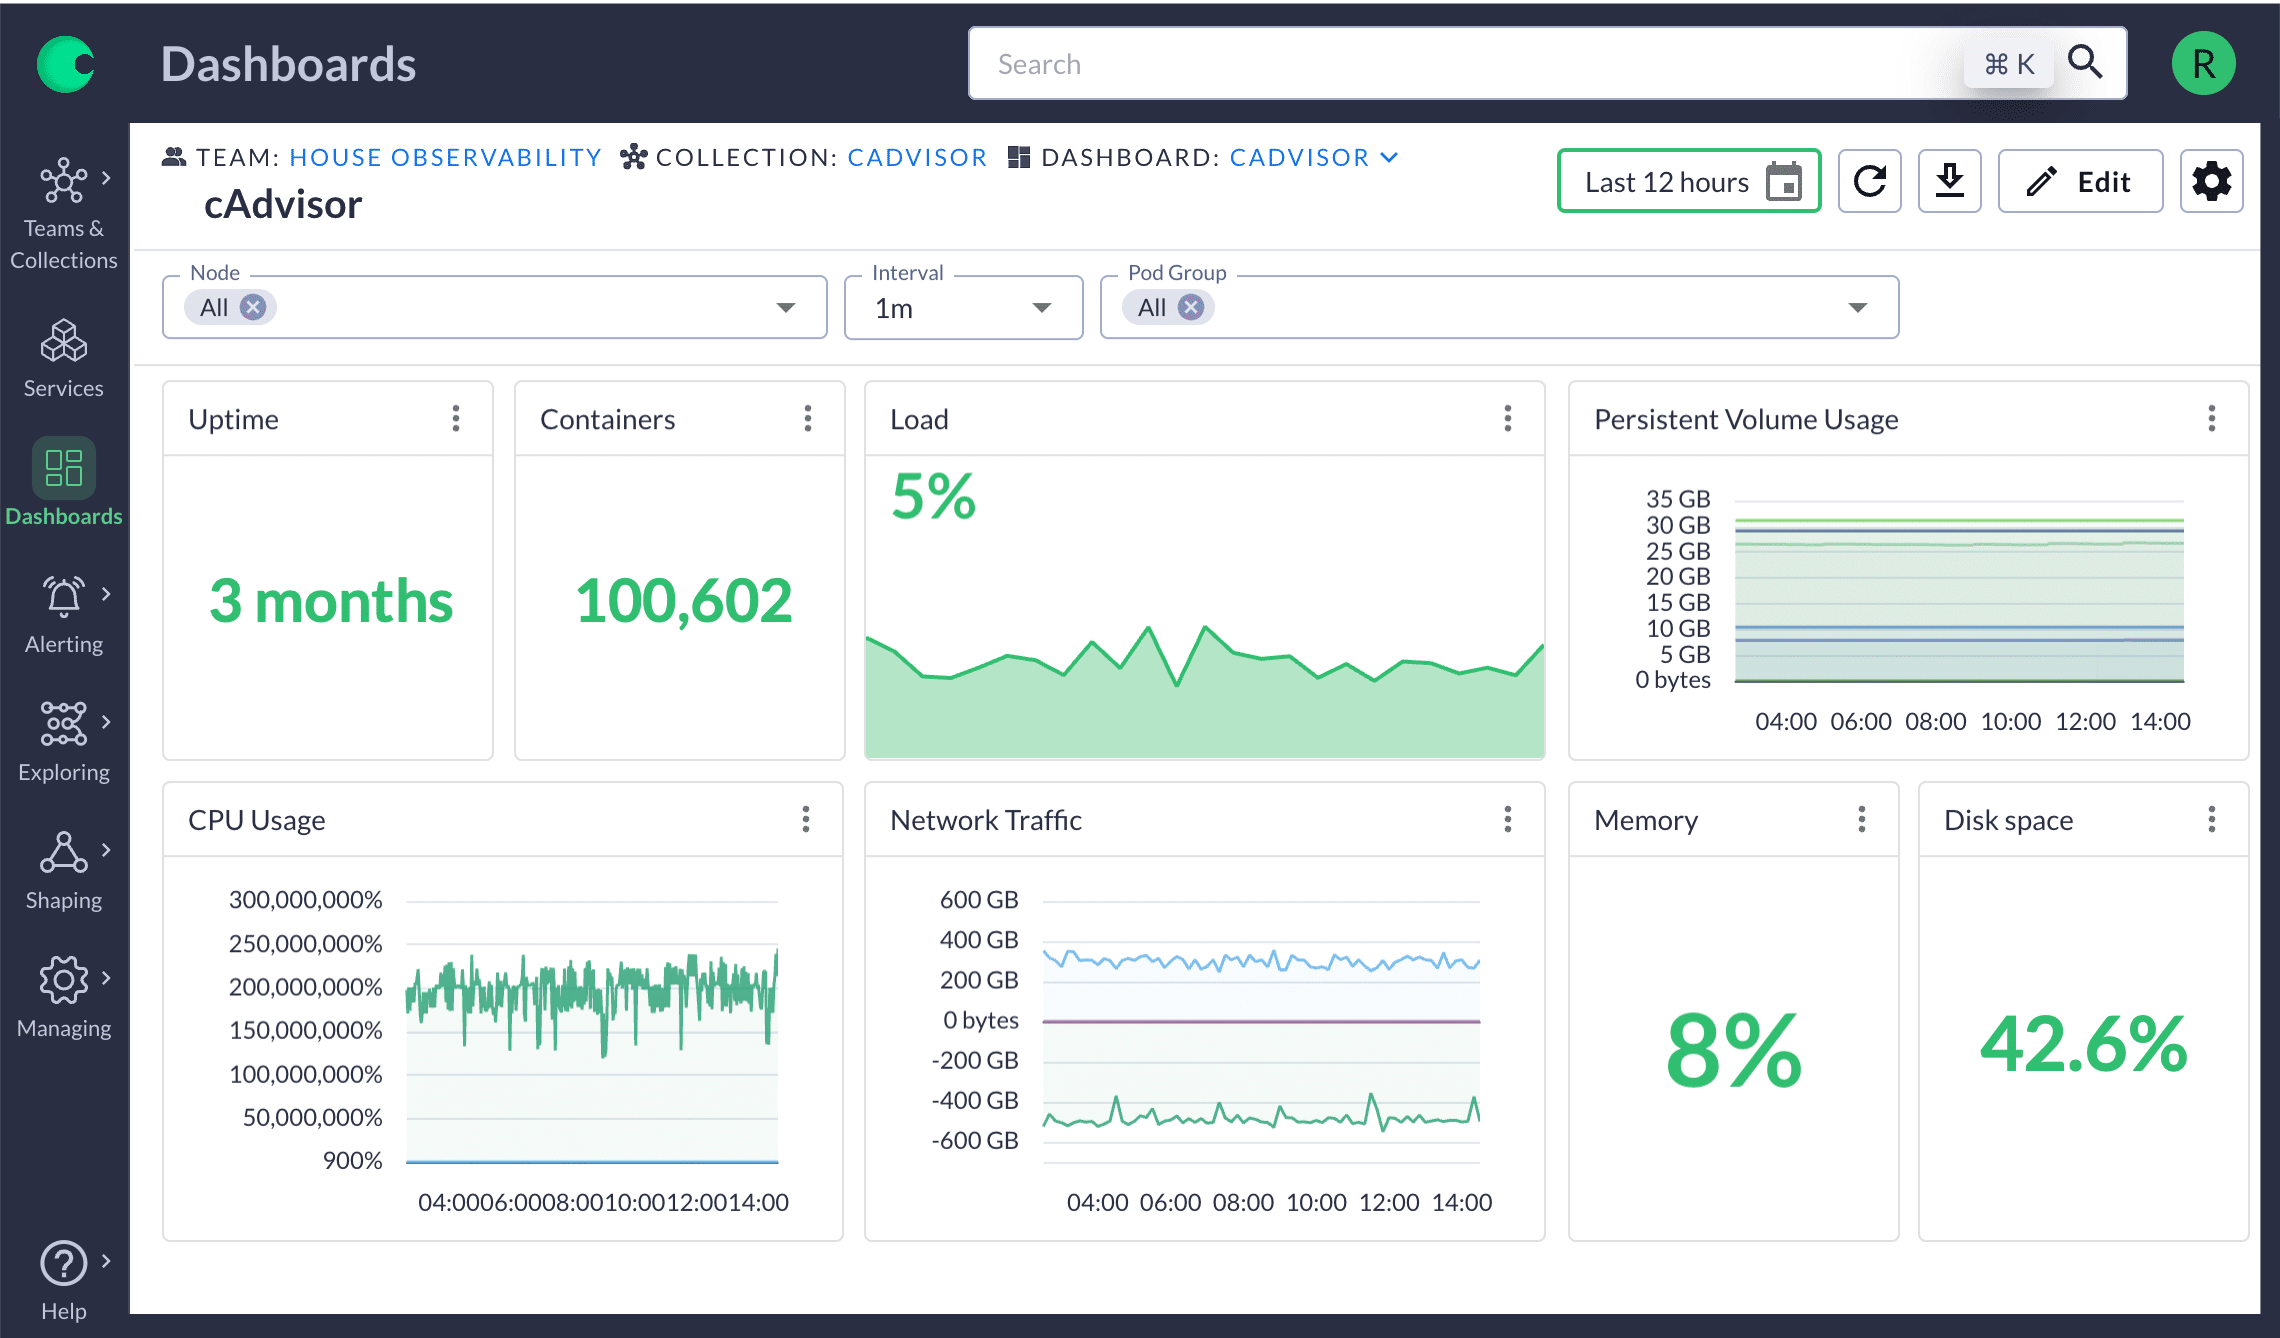
From the cluster down to the node and everything in between, the platform ensures you can keep pace with a rapidly changing environment, with out-of-the-box dashboards that give you the precision and context that's critical for modern infrastructure.
Support for all major container platforms
Chronosphere can monitor all major container platforms from the top Kubernetes distributions: Amazon Elastic Kubernetes Service, Azure Kubernetes Service, and Google Kubernetes Engine, as well as popular container services like Amazon Elastic Container Service.
New nodes and pods are continuously discovered and integrated into dashboards and alerts so you always have full visibility into cluster utilization and service health.
Unified visibility across telemetry delivers operational excellence
Gain a holistic view of your infrastructure health with Chronosphere's unified platform. Correlate metrics, logs and events, and understand the impact of system changes for swift and well-informed decision making.
Understand performance at a cluster, namespace, service, node, or pod level. Rapid alerting turns data into actionable insights, empowering you to find bottlenecks and get ahead of t disruptions, maintaining operational excellence.


Open Source Compatible
Ingest data in nearly any open source protocol, from Prometheus to Graphite/StatsD to OpenTelemetry. Or, if you’re coming from a proprietary solution, Chronosphere can natively ingest DogStatsD, SignalFx, and Wavefront metrics.
Effortlessly import community-driven Grafana dashboards and tap into a vast resource pool for diverse monitoring needs—from Kubernetes to databases like Redis or Postgres. Create queries in QueryBuilder, making PromQL accessible for all.
Key Capabilities
Ensure cluster reliability
Meet your customer SLAs with highly reliable and available infrastructure.
Discover bottlenecks faster
Improve performance by understanding which services are consuming more than their fair share of resources and which are resource-starved.
Rapidly troubleshoot issues
When incidents arise, remediate them quickly and painlessly.