")


As the world evolves from monolithic and service-oriented architectures (SOA) to cloud native, or microservices, organizations are often confused about how they should be using application performance monitoring (APM) and distributed tracing. To many they seem similar, but they can be different and can help you answer different questions.
Understanding how these solutions complement and differ from one another is crucial for selecting the right approach to ensure you can quickly remediate issues and optimize your system’s performance.
A brief history lesson
APM as we know it came into existence between the monolithic to SOA evolution of software architecture. SOA introduced more flexibility by breaking services out by “functional domains” that are loosely connected but communicated via a common unified layer that routed front-end requests to the appropriate service. This increased the number of components involved in a request compared to a monolith, but were still relatively fewer compared to a microservices architecture (more on that in a bit).
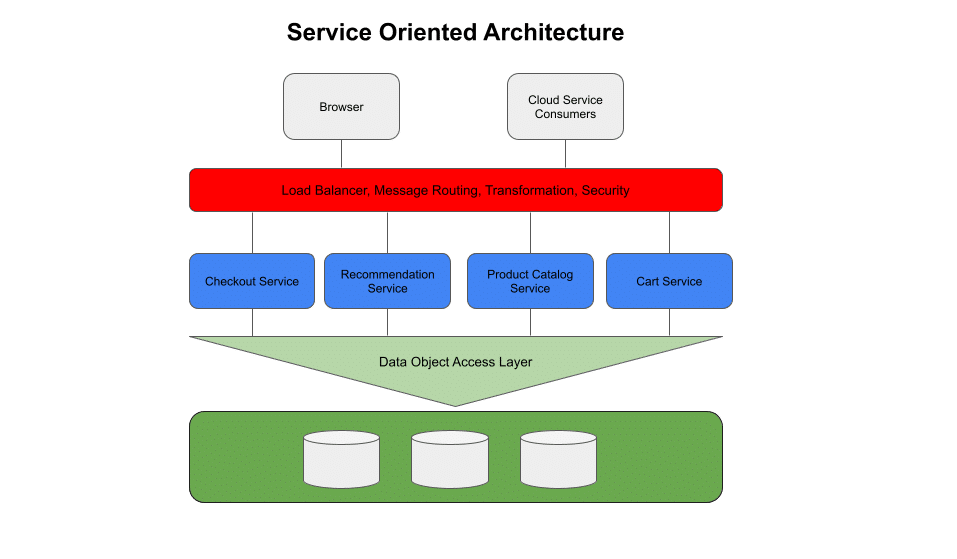
While SOA increased the number of components in the system as a whole, the number of components involved in any given end-user request generally saw little to no change, so it was more important to be able to introspect services than to understand how they worked together, assuming they did at all.
Microservices architectures break the “functional domains” into even smaller, relatively simple discrete functions compared to their SOA counterparts. Microservices don’t require a common unified layer to communicate. Instead, they communicate service to service via APIs.
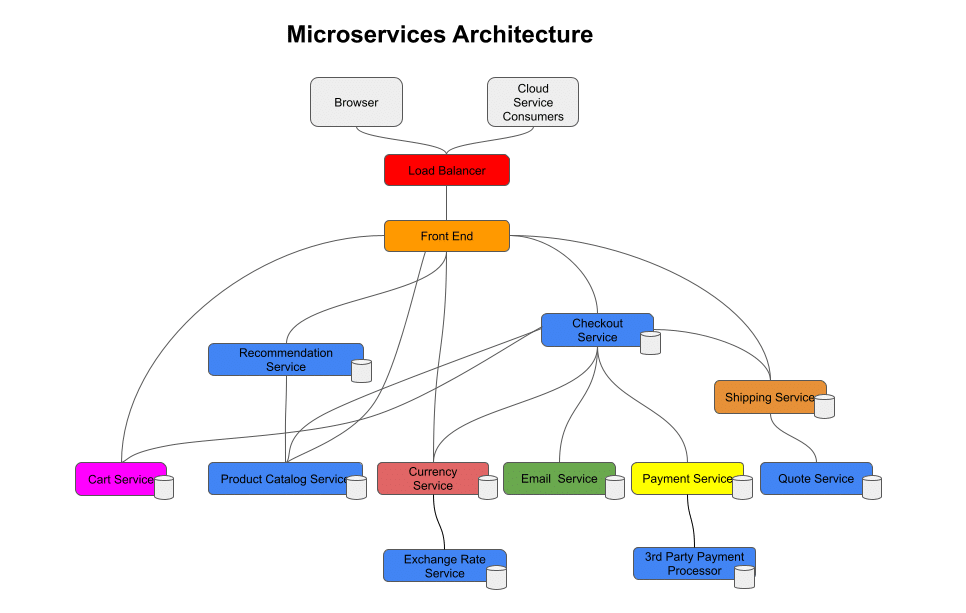
Because the services are smaller, the amount of communication or “steps” required to complete a transaction is much higher, and the environment is highly dynamic, the complexity has moved from within individual services to between a collection of services that are involved in handling a given request. This is what distributed tracing is designed to help with.
Let’s take a closer look at each to understand the use cases.
What is APM?: Introspection for application health
APM assumes that the system under observation is relatively static, with few variables besides changes to individual services, and thus is designed to answer the question, “How is my service behaving?” It assumes complexity is centered within an application so it gives you a lot of service-oriented angles to provide detailed insights into a specific service or application’s internal workings. This is done with a combination of different types of telemetry, including:
- Transaction traces: Tracks the path of requests within an application.
- Metrics: Measures performance indicators like response times and error rates.
- Events and logs: Captures contextual information around application behavior.
- Code profiling: Pinpoints performance bottlenecks down to specific lines of code.
Distributed tracing: Following the request journey
Distributed tracing assumes that the system under observation is highly dynamic, with many variables such as the number of microservices in a request, the changes being made to those services by the team owners, and even the underlying infrastructure which changes dynamically in response to load. As such, distributed tracing focuses on the question, “How are my services working together?” Distributed tracing is particularly suited to microservices architectures, where many services may cooperate to handle a given end-user request, and understanding the flow from end-to-end can be quite complex.
The way distributed tracing works is fundamentally similar to the transaction traces that were historically introduced by APM. Instrumented applications emit spans, with each span representing a unit of work within a request. Each span has a Trace ID associated with it, that identifies the unique request within the system that the span belongs to. By querying all of the spans associated with a Trace ID, we can visualize the complete journey of that request, even across multiple services. Consider an example alert notifying you about elevated checkout failures; with distributed tracing, you can analyze the entire checkout request journey across all of the services involved, and see that the checkout failures actually originate from errors in the downstream Quote Service, and then analyze the attributes across failed requests to see what they have in common, such as a specific payment provider.
With APM, the ability to analyze this complete journey is minimal, and the visibility into cross-service interactions is likewise more minimal. In this same scenario, APM would quickly tell you that the checkout service is not to blame for the elevated checkout failures, but you would likely have to sift through the services involved in the checkout request journey one by one in order to determine that the issue is originating from the quote service.
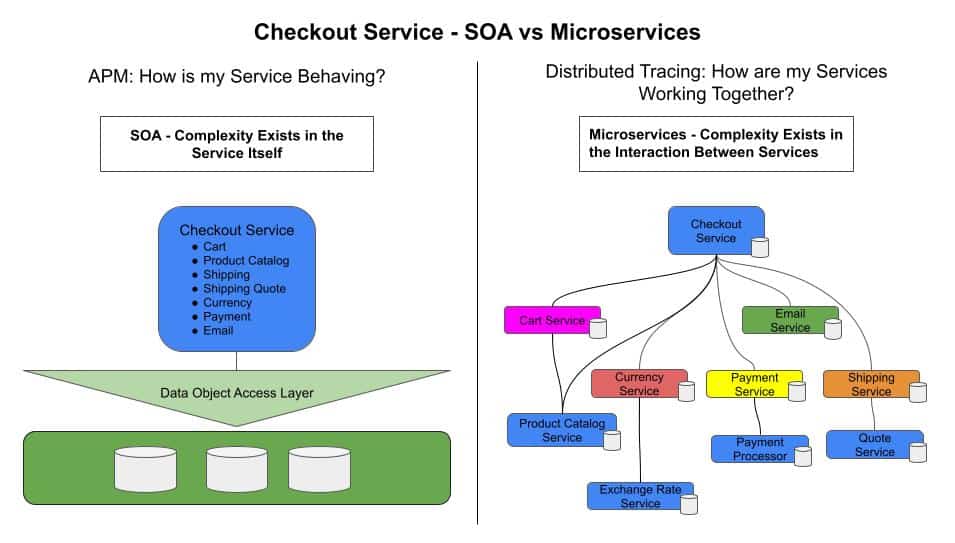
Our example in Figure 3 is pretty simple. Imagine trying to troubleshoot a system similar to the one in Figure 4 below by going service-to-service.
Due to market needs, the lines between APM and distributed tracing have become increasingly blurred. Many APM vendors are incorporating the more request-oriented perspectives offered by distributed tracing to provide a broader view. They see the changes that are coming and want to be able to provide newer capabilities as an extension of their existing APM capabilities.
At the same time, distributed tracing products are trying to make adoption easier, so they are adding “APM-like” perspectives as a bridge to cut the learning curve for customers that are coming to them from APM solutions.
This makes understanding whether a product is APM-first versus distributed tracing-first very confusing!
Distributed tracing vs. APM: Choosing the right tool
Selecting the right solution depends on the problem you are trying to solve:
APM-first solutions will excel at providing insights into application behavior and internals, and are a great solution when you are having trouble understanding the health/performance of your application. They frequently feature capabilities like code-level insights/profiling that help you identify and fix performance issues in production.
Example: Which controller action or routes are the slowest?
Tracing-first solutions should provide insights into request behavior across services, isolating problematic microservices, and pinpointing the source of latency or errors in distributed systems using capabilities such as error/latency correlation, or tag analysis to help you identify the segments of each span that impact the total duration of a trace.
Example: How do changes in one service affect the performance of other services?
Beyond the label
In a cloud native world, the super-fine diagnostics often found in APM tools are often less necessary. With microservices architectures, teams find themselves spending more time tracking problems back to the service(s) they originate from and identifying the right team/on-call engineer to bring in, rather than digging into a problematic service to understand what is responsible for a given issue.
Don’t get fixated on a product’s label as “APM” or “distributed tracing.” Instead, prioritize the solutions that best address your current pain points. Look for capabilities such as error and latency analysis, tag-based filtering, and visualizations that help you quickly understand how your distributed system is performing.
Additional resources
Curious in learning more about Chronosphere and distributed tracing?


