")


Telemetry data control
Chronosphere is the pioneer in telemetry data control. We started with metrics, and our Metrics Traffic Analyzer and Metrics Usage Analyzer help customers make data-driven decisions about which metrics to keep and which to discard. Customers have used our tooling to reduce the volume of metrics they persist by 60%, on average, while improving developer workflows.
We’re now focusing on providing similar control-focused features across other telemetry types, starting with tracing.
Tracing “control” today
Trace data is extremely high volume, especially for large-scale microservices environments. Most customers do not want to generate, egress, store, or query across the entire volume of their trace data — it is too expensive on the administrative side and too clumsy and confusing on the developer experience side.
Head-based and tail-based sampling is often used to help address the financial expense and confusing developer user experience by reducing the number of spans generated and stored.
Head-based sampling makes a decision to collect a fraction (all, none, or some) of trace data at the beginning of the trace, that is, when the trace is first initiated. This type of sampling will deliver a consistent set of trace data and lower administrative costs, but it might sample away important developer information occurring later in the trace, such as errors or slow requests.
Tail-based sampling decides after the entire trace has been completed. Thus, it can analyze the whole trace and selectively report the traces that include errors or have high latency. However, tail-based sampling can be more resource-intensive as it requires storing and processing all trace data before deciding what to report.
Most organizations set a low global head-based sampling rate (ex., probabilistic sampling at 1%, or some fraction of 1%) to reduce processing and egress costs and use tail-based sampling on the server side to capture only the traces generated that are deemed valuable.
The problem with today’s approach
Trace data is most useful when helping an engineer diagnose a specific problem. Using a global head-based sampling rate is unlikely to capture what you need when you need it most. Quickly changing sampling rates has historically been difficult, as it usually requires a redeploy of the service/configmaps/collectors. This is one (of many) reasons why trace data hasn’t been delivering the value promised.
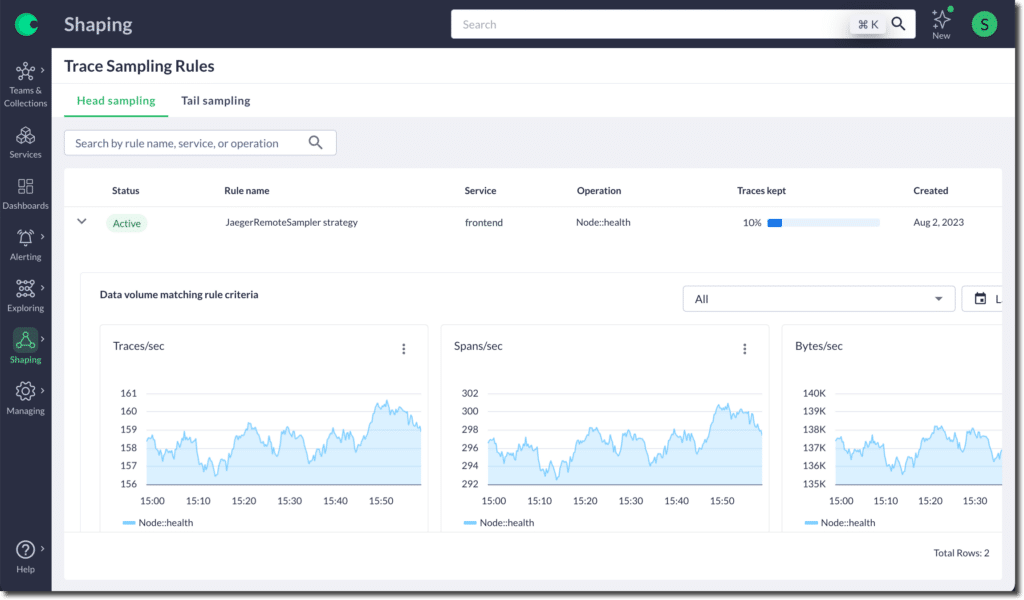
Introducing dynamic head-based and tail-based sampling
Chronosphere customers can now dynamically adjust their head sampling rates without redeploying their services/configmaps/collectors. This operation uses the OTel Collector and requires no third-party software client side. Head sampling rates can be adjusted as frequently as every 15 seconds.
There are many use cases for this capability. For example, it can help dynamically control the amount of trace data being egressed when there is a sudden spike to help mitigate processing and egress costs. But let’s focus on the use case mentioned above — assisting an engineer in diagnosing a specific problem.
When an incident occurs, you can quickly increase the head-based sampling rate at the microservices level or independently for a given set of operations within a microservice. You can turn it back down when the increased trace data is no longer needed. These adjustments can be made centrally, based on information about the relevant data for a given alert, to help engineers quickly identify the source of the problem.
With increased trace data being egressed, Chronosphere’s tail-based sampling rules can be applied before it is persisted to control costs and ensure that a higher portion of more valuable data is stored and a lower portion of less critical data is stored.
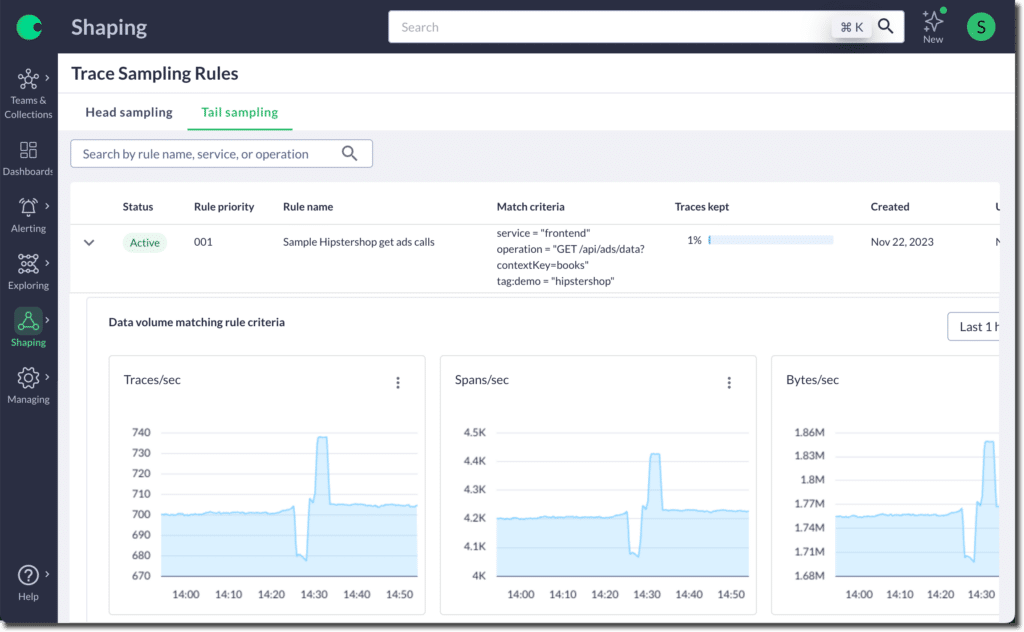
Using dynamic head-based sampling in conjunction with tail-based sampling allows you to derive the most value from your trace data when needed while controlling costs.
We’re just getting started
As stated at the beginning, Chronosphere is the pioneer of telemetry data control. Our focus is on giving companies the tools they need to realize the most value from their telemetry data, and this is just the beginning of control for tracing data. Stay tuned!
To learn more about these features, please schedule a demo


