


Today at Kubecon we launched a new release of our best-in-class cloud native observability platform that delivers a brand new approach to observability workflows, designed for the way cloud native engineering teams need and want to work.
Chronosphere has had tremendous success and become one of the fastest growing SaaS companies because of our ability to get observability data under control. Chronosphere customers reduce observability data volumes by an average of 48% while improving key metrics such as time to detection and time to remediation. The new release of the Chronosphere platform builds on this momentum with new features that expand benefits beyond central observability teams and makes the life of engineering teams easier. The new features streamline workflows, accelerate remediation, and improve engineer efficiency and quality of life.
Today’s APM tools don’t support cloud native
Most observability and APM tools available today don’t support how born-in-the-cloud or enterprise companies — and the developers within their organizations — develop, deploy, and support their applications and infrastructure. Modern organizations build software by organizing people into small, interdependent engineering teams, focused on the services/features for which they’re responsible. But the tools they’re using don’t reflect the way they organize, or the relationships between them. In a DevOps world, developers own responsibility for the operations of their applications, rather than throwing them over the wall to an IT Ops team. Consequently, observability solutions need to support workflows more aligned with how distributed, interdependent engineering teams work.
For many organizations, observability tools and processes were developed from the bottom up: engineers build dashboards, reports, and other artifacts within their own worldview in isolation from the rest of the organization. This lets engineers execute quickly, but it causes problems at scale. An engineer logging into their observability tool is overwhelmed by a sea of data with very little ability to navigate. Finding the right data is nearly impossible. To make it worse, dashboards load slowly or not at all. On-call shifts are chaotic and newer team members end up escalating issues to power users who are the only ones who seem to know where to look.
Because of the disconnect between what engineers need and what today’s tools actually deliver, organizations are increasingly experiencing the following pains:
- Longer troubleshooting times. Broken observability processes and workflows place enormous pressure on DevOps teams and engineers. Some of the issues that lengthen troubleshooting times include:
- Data is too hard to find – With today’s APM and observability tools, the volume of observability data is unnavigable. An engineer is overwhelmed by a vast sea of data when they log in. Data relevant to an issue takes too long to find, making even simple issues take longer to isolate and fix.
- Data is not organized or in context – Data is not organized or in sync with the engineering organization’s team structure and the services they support. Consequently, issue resolution often relies on institutional knowledge and power users.
- Hard to get from “there is a problem” to “where is the problem” – Metrics tell you that there is a problem, tracing tells you where the problem is. However, tracing can be very noisy, which means an engineer has to sift through all the spans to find the problematic one. This, once again, lengthens troubleshooting times.
- Slower dashboards and queries. The volume and complexity of observability data (e.g. high cardinality) not only increases costs but hurts the performance of queries and dashboards. Optimizing queries is a manual, time-intensive task, so engineers often need to bother the query experts on the central observability team (who are then taken away from more meaningful work) or they mostly live with the pain. Engineers experience more and more idle time as they wait for queries to return results and dashboards to load.
- Engineer burnout. When data becomes overwhelming and disorganized, valuable engineer time is spent just searching to find the right data to fix an issue. Engineers lose confidence in their observability or monitoring platform. On-call engineers get paged more often and it takes them much longer to fix things. In addition, they’re always under pressure to stay within budget while data volumes grow. It affects their quality of life and increases staff turnover.
Chronosphere is designed for the way cloud native engineering teams need and want to work
Chronosphere announced a major enhancement to our Observability platform that empowers customers to organize and navigate their ever-growing sea of observability data to reduce the burden on engineers, and make them more productive. New capabilities include:
Workspaces and Collections
Now in preview, Workspaces are the views through which customers experience Chronosphere. They are designed to reflect how modern cloud native software companies organize their services and people. Workspaces give customers a global view of all their data, and the power to then easily zoom in on the data most relevant to the services for which individual engineering teams are responsible.
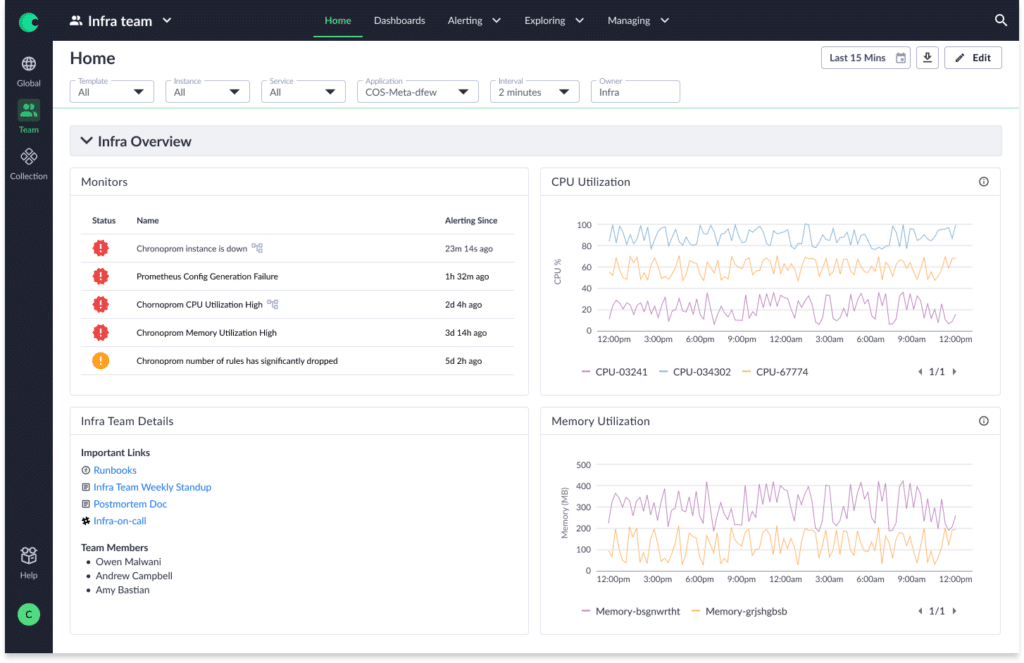
Customers can align their organizations and workflows in Chronosphere with multiple views that teams and engineers can navigate:
- Global view – The global view is the 30k foot, global view of all of the data in a tenant.
- Team view – the Team view is the primary view and where most engineers start when they log in to Chronosphere. Chronosphere users are grouped into Teams, and each Team owns one or more Collections. Collections serve as the organizational construct for a service or feature. The Team view becomes the parent view for all of the artifacts within each Collection that Team owns. This maps to how software organizations already structure their engineers: They’re organized into teams, with each team sharing responsibility for “their stuff” (ie: their code, services, and/or infrastructure).
- Collections view is the user’s window into the individual service or feature they are responsible for. Each Collection consists of a home dashboard, other dashboards, and monitors.
Workspaces and Collections put data into context: users can see the data most relevant to them and can also easily find data for their dependencies. For example, a team 1 engineer’s service may be dependent on a team 2 engineer’s service. Now Team 1 engineer can navigate to Team 2 engineer’s Collection to find data they need to troubleshoot their service. Workspaces and Collections helps interdependent teams discover other things that may be helpful for their service, so they can respond to and remediate issues with unprecedented speed.
Query Accelerator
Released October 7th, Query Accelerator reduces idle time and improves engineer productivity by delivering an optimal dashboard experience and faster query response. For slow queries that use aggregation, engineers no longer have to waste cycles trying to improve them.
When a slow query is detected, Query Accelerator will create a pre-aggregated time series of the data point to ensure faster performance. Query Accelerator will look for similar queries across all dashboards and utilize the faster, pre-aggregated version instead.
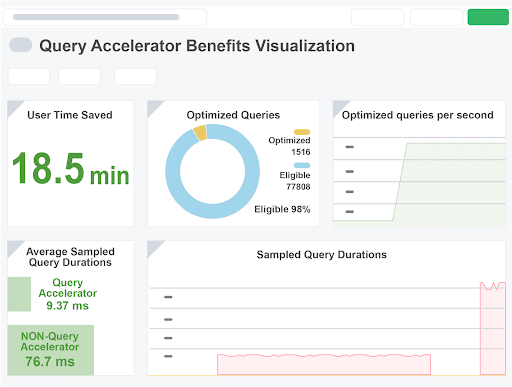
Query Accelerator automatically and continuously scans for slow dashboard queries and augments them with their faster alternative. Engineers no longer have to be proficient at writing “good queries.” They can create a query that returns the data they need, and Query Accelerator will ensure that it performs optimally on every dashboard where it is used.
For central observability teams, Chronosphere provides insights into the query acceleration process and the achieved benefits, in addition to faster dashboards. They can track the number of optimized queries, engineering hours saved, and other pertinent metrics. Query Accelerator also reduces the central observability team’s involvement in query optimization, freeing them for more impactful work.
Trace Metrics
Chronosphere customers can now define metrics based on traces returned from a query. A trace metric enables you to generate a new metric data point based on an entire trace or part of a trace. The metric can then be used to create an alert and/or a dashboard.
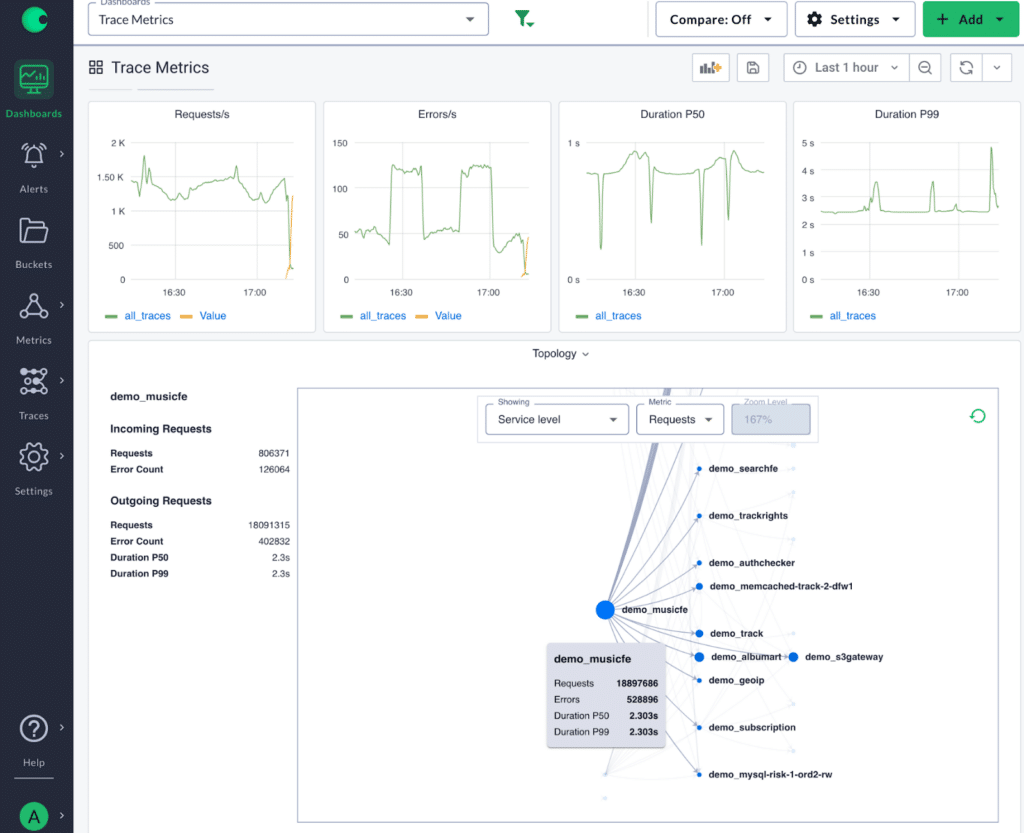
As mentioned earlier, metrics tell an engineer there is a problem, tracing tells that engineer where the problem lies. However, tracing is too noisy and you have to navigate all the spans to find the problematic span. Trace metrics dramatically accelerate finding the “where” because now you can see the top span which is presenting the highest error rate without having to search through every span.
The ability to jump from a trace metric alert or dashboard into the associated trace data gives users a powerful tool in the triage process to find where a new error or latency can be found.
Quotas
Quotas provide the central observability team (COT) with an easy way to allocate licensed data capacity amongst teams and services. Using percentages, the available capacity can be divided into pools and then those pools can be divided into quotas for each service and/or team.
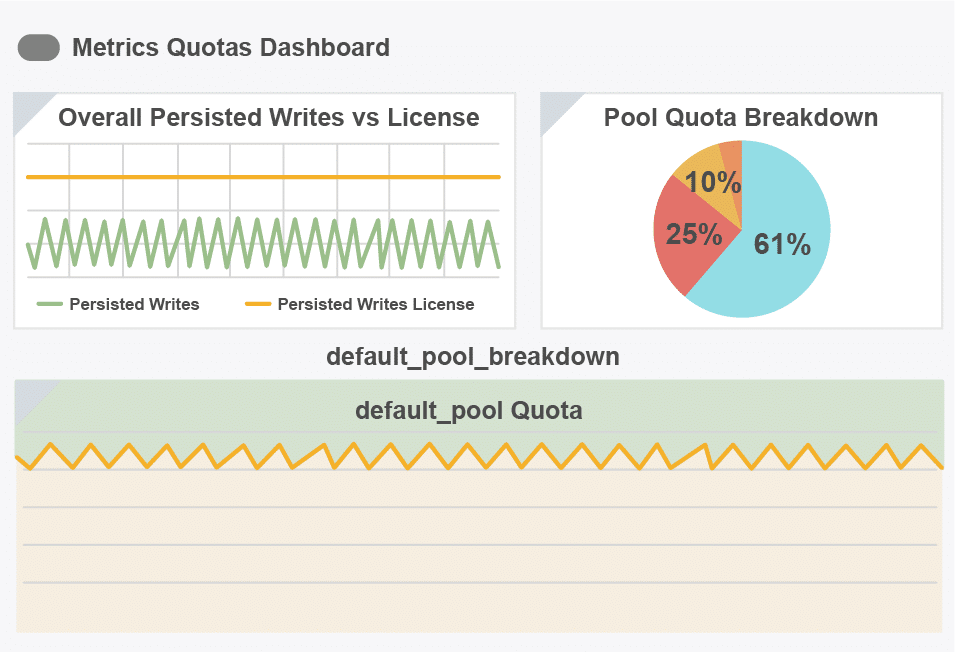
Quotas allows the COT to understand the usage and any penalties that occur when the assigned amount is exceeded. For the service owner, they can now prioritize traffic within the service(s) they own. They can also see the impact of their changes and decide what data to protect or sacrifice.
What this means for cloud native engineering teams
Rather than the chaotic, bottoms up approach most organizations employ, Chronosphere makes it easy for central observability teams, service owners, and engineering teams to balance control and flexibility to make engineers more productive:
- Faster troubleshooting times.
- Quickly find the right data – Chronosphere presents the right data in the right context so engineers and developers can quickly find what they’re looking for, respond to alerts, and remediate issues more effectively. It’s an improved experience for engineers, that makes finding data more intuitive, simpler and fasterAlign Data and Observability processes to your organization – Each team and engineer has the data most relevant to their responsibilities. They’re able to encode institutional knowledge and service expertise into Chronosphere, where it can help less knowledgeable teammates more quickly.
- Faster problem isolation – Engineers can quickly compute metrics from trace data so they not only know that there is a problem, but can more quickly and easily identify where the problem lies.
- Faster dashboards and queries. Engineers reduce the idle time that results from slow queries and dashboards. There’s less disruption to their workflows and thought patterns. The panels engineers need to manipulate during their debugging process are quick and responsive.
- Happier, more productive engineers and developers. Engineers will spend less time searching for the data they need, either during triage or while monitoring the services for which they’re responsible. They also have better visibility into their data allocation and usage so staying within budget is less work. On-call shifts are less stressful and less time-consuming because they can find the right data, run queries quickly, and remediate issues faster.
Since its inception, Chronosphere has helped central observability teams tame rampant observability data growth while improving key metrics such as MTTD, MTTR, and positively affecting business outcomes. And Chronosphere has been committed to making open source, Prometheus-based monitoring easier to adopt and use. With these new features, Chronosphere is delivering a brand new approach to cloud native observability, one that is designed specifically for how cloud native engineering teams need and want to work. And likely give them a little more life in their work-life balance.


