

What are distributed tracing tools? Distributed tracing tools help you track a request through an application or system that consists of multiple applications, services, and infrastructure.
This gives you a deeper understanding of what is happening within the system through graphical representations of how much time the request took on each step. A span is the building block of any distributed trace, with each component in a service contributing a span to the distributed workflow.
There are a handful of well known open source tracing tools, and another handful of lesser known ones. Most work in similar ways, with one or two nuanced differences, and this post walks through most of them to help find the right distributed tracing tools for you.
Dapper
While not available to download or use outside of Google, Dapper is/was the company’s internal tool that defined what distributed tracing could be. You can read the paper from 2010 written by some of the engineers behind it to get an understanding of the design decisions behind the tracing tools that came after it.
OpenTelemetry
As part of the wider effort from the Cloud Native Computing Foundation (CNCF) to bring consistency and consolidation to the APIs and instrumentation needed for distributed tracing and the wider observability landscape. The OpenTelemetry API provides a standard, vendor neutral framework for instrumentation, meaning that a developer can switch between distributed tracing systems. Not all tracing tools conform fully to it yet (and some conform to the predecessor, OpenTracing, but many do to some degree.
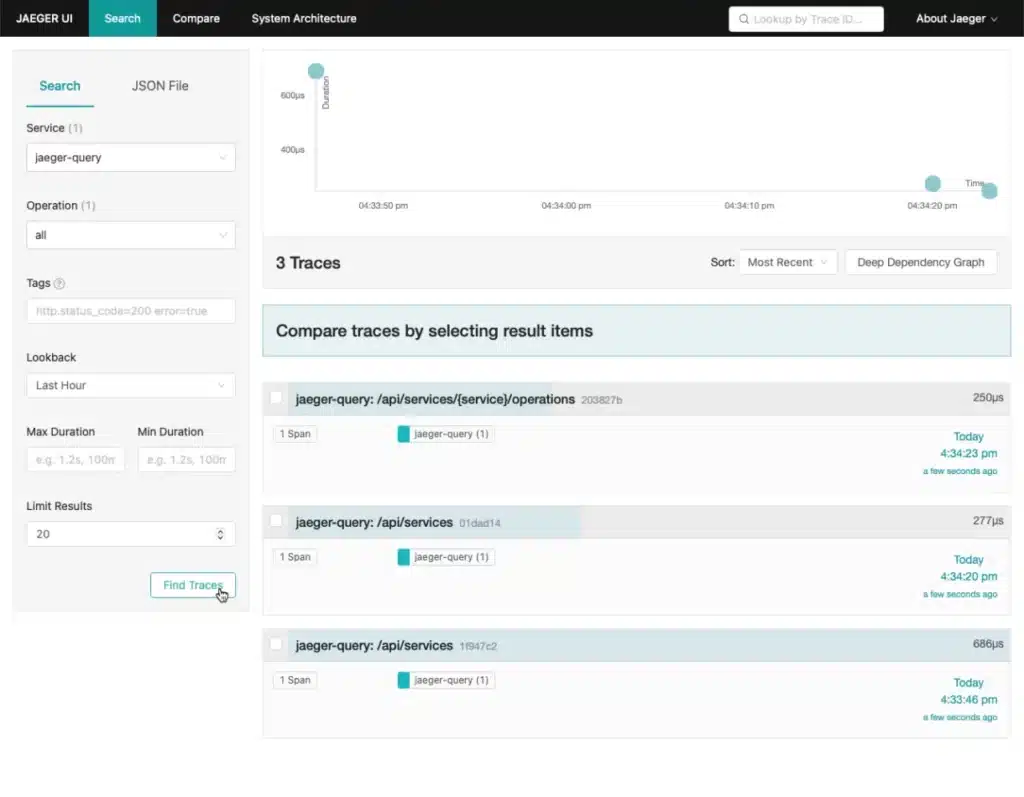
Jaeger
Created by Uber and now a graduated project of the CNCF, Jaeger has become one of the defining tracing tools. The team behind it explained their needs and motivations in a 2017 blog post, which were primarily to troubleshoot their growing microservices-based applications, and specifically:
- Distributed context propagation
- Distributed transaction monitoring
- Root cause analysis
- Service dependency analysis
- Performance / latency optimization
For flexibility across mixed environments, Jaeger supports OpenTracing compatibility and instrumentation in Go, Java, Node, Python, C++ and C# and storage in Cassandra, Elasticsearch, and memory.
Jaeger presents trace data as a series of traces that match a query. Clicking into an individual trace gives more context on the trace, and the spans that make up the trace. You can view the trace data as a timeline, graph, table, and other ways. If you select more than one trace, you can compare the structural aspects between them.
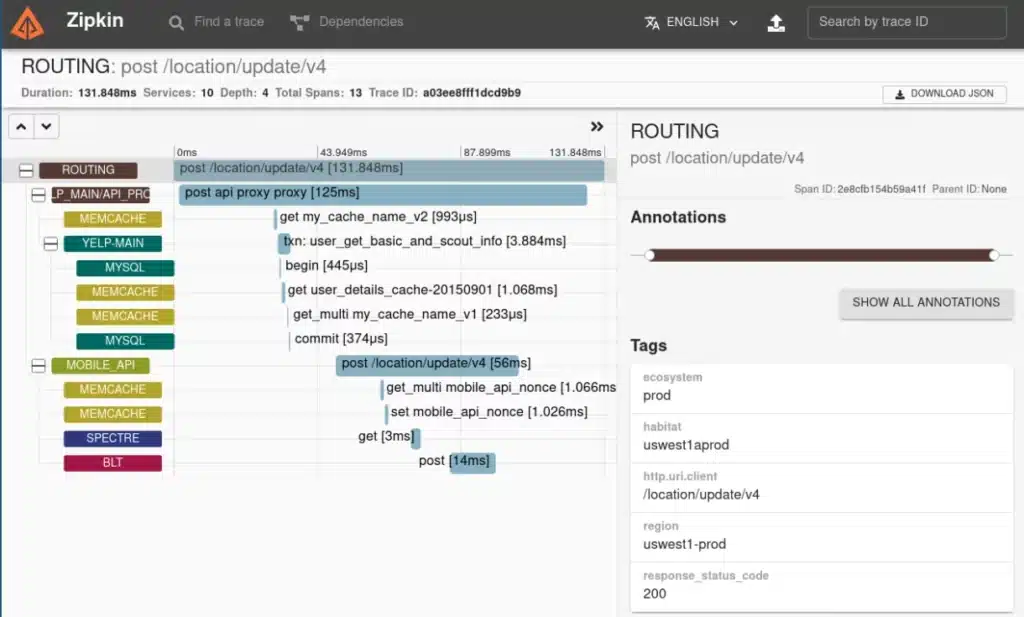
Zipkin
Originally created at Twitter, and now run by the OpenZipkin community, Zipkin mostly focuses on troubleshooting latency issues with services. Searching traces involves using a form of custom query language that can take a little time to understand. Zipkin supports OpenTracing compatibility and instrumentation in C#, Go, Java, JavaScript, Ruby, Scala, and PHP, with dozens of community supported options too. When comparing Zipkin vs Jaeger tracing tools, they have similar compatibility services, but their own way of displaying the data.
Appdash
From Sourcegraph, and based on Zipkin and Dapper, Appdash has clients for Go and Python, and supports the OpenTracing API.
As a tracing tool, Appdash traces the end-to-end handling of requests and operations in your application. It displays timings and application-specific metadata for each step to debug performance issues, and displays traces in tree and timeline views for each request and its children.
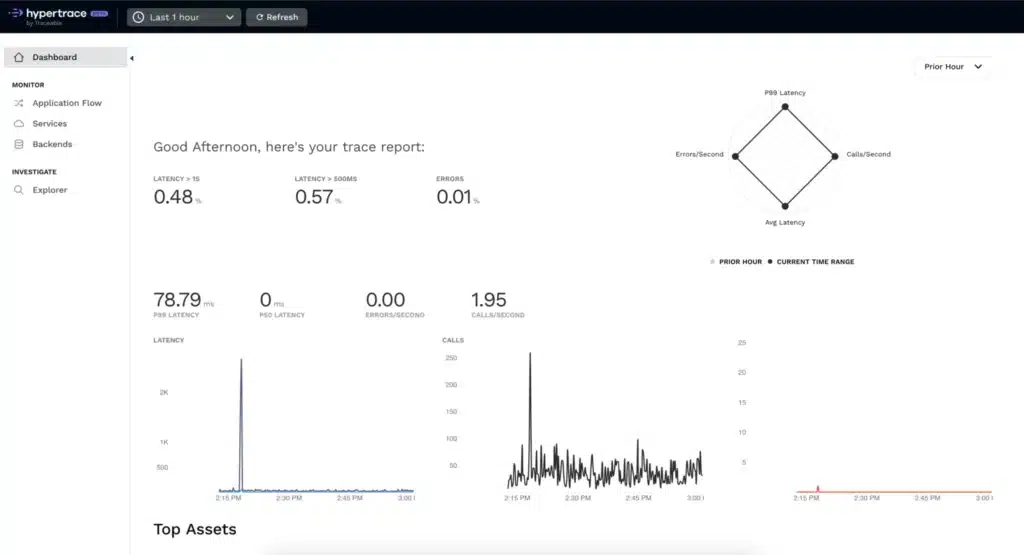
Hypertrace
Created by Traceable(!), hypertrace “accepts all major tracing data formats”. In addition to the expected search and visualization of traces, hypertrace adds a couple of other convenience features typically found in more fully fledged observability and tracing tools such as:
- Service graph and metrics aggregation in real time.
- Custom dashboards.
- Path-based analysis of requests.
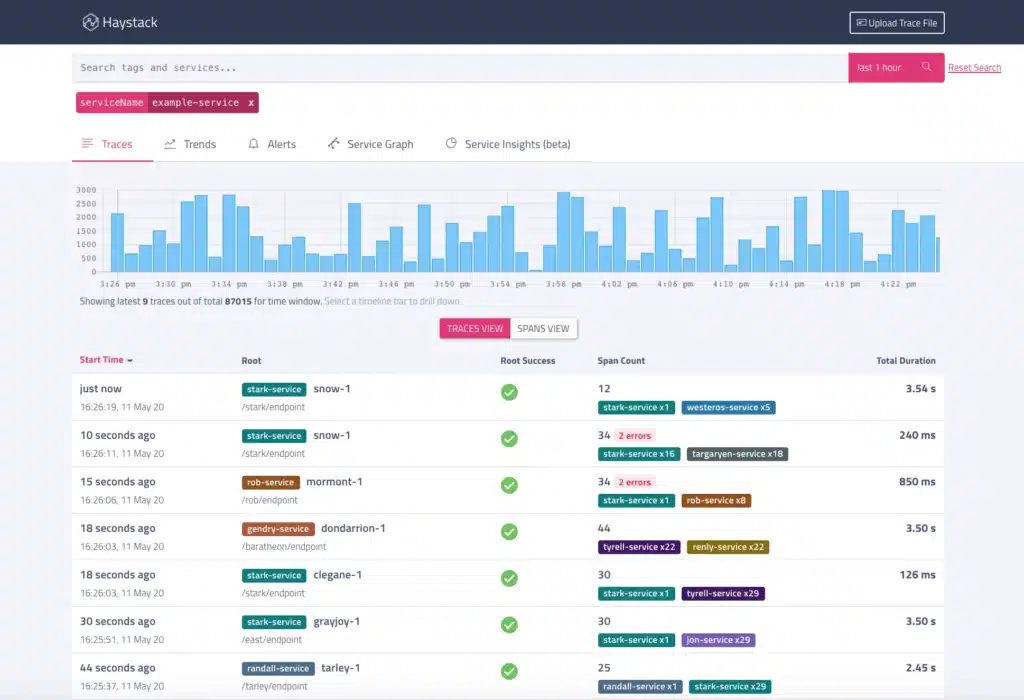
Haystack
Created by Expedia, Haystack is OpenTracing compliant and has one gRPC agent library and is mostly designed for teams already using Kafka. In addition to the visualization of traces and dependencies, Haystack adds one other more unique feature, using OpenTracing data to track trends and anomaly detection.
Apache SkyWalking
Combining logging, metrics, and tracing into one tool, Apache SkyWalking has clients for Java, .Net Core, PHP, NodeJS, Golang, LUA, C++, and Python, but isn’t OpenTracing compliant. As an all-in-one application performance monitoring (APM) tool, SkyWalking is more complex to set up and opinionated, so not the best choice if you have existing tracing tools you want to integrate with.
What’s the Point of Distributed Tracing Tools?
Get to the source. Adding tracing to a distributed application helps you debug the connections and requests between multiple disparate components. However, taking that trace data and relating it to other meaningful metrics information generated by an application remains a challenge. Chronosphere tracing ties together distributed traces and metrics data to help you get a full picture of what’s happening in an application and what’s important.
Want to learn more about Chronosphere tracing?
Schedule a Demo to See What Chronosphere’s Distributed Tracing Tool Can Do for You


