Scale Prometheus
SCALING WITH PROMETHEUS MONITORING EXPLAINED AND HOW TO ADAPT
While Prometheus is the best starting place for cloud native metrics, many organizations struggle with running their own Prometheus instances as they scale. Learn what these common challenges are and how you can overcome them.
Prometheus Monitoring: The Backstory
Since it was first developed by SoundCloud in 2012, Prometheus has grown into the de-facto standard for monitoring in cloud-native environments. It was the second project, after Kubernetes, to be graduated by the Cloud Native Computing Foundation (CNCF).
When Prometheus first emerged, most companies were relying on StatsD and Graphite for monitoring, but as the world shifted to microservices-oriented architecture on container-based infrastructure, companies found these legacy tools insufficient.
What is Prometheus Monitoring?
Prometheus monitoring was designed to be simple to operate, quick to set up and provide immediate value out of the box, but it also offered a label-based approach to monitoring data. This allows users to pivot, group and explore their data along many dimensions which is far better suited for modern cloud-native architectures than the flat hierarchy structure implemented by statsD and Graphite. Largely for those reasons — and the backing of the CNCF — Prometheus has become the clear leader in open source cloud-native monitoring.
The widespread adoption of Prometheus has also changed some of the core dynamics in the monitoring industry. Today, most technologies in the cloud-native landscape provide instrumentation out of the box in the open source Prometheus format. It’s not just the instrumentation either, the standardization of PromQL as the monitoring query language means everyone benefits from the broader community of shared Grafana dashboards and Prometheus alert definitions.
A modern user of software no longer needs to depend on the black box magic of the monitoring vendor’s agent for instrumentation or be locked in to vendor specific dashboarding and alerting. All of this is now provided and maintained by the producers of the software and the broader community – and it’s all open.
Prometheus Management: It’s No Longer So Simple
Prometheus’ single binary implementation for ingestion, storage, and querying makes it ideal as a lightweight metrics and monitoring solution with quick time to value — perfect for cloud-native environments.
But simplicity and ease have their trade-offs: as organizations inevitably scale up their infrastructure footprint and number of microservices, you need to stand up multiple Prometheus instances, which requires significant management overhead.
Free up developer time and headspace
Abnormal Security partnered with Chronosphere when they realized their Prometheus + Grafana monitoring solution had reached its limits. They were unable to scale with the usage of its fast-growing cloud-native application. Chronosphere helped them to cut observability costs, boost platform reliability & performance |
The challenges of Prometheus scaling and monitoring
Prometheus was originally designed in the early days of cloud-native architectures — before organizations were seriously scaling their cloud-native applications. At scale, using Prometheus starts to introduce pain and problems for both the end users of the data as well as the team that manages it.
Here are some of the ways that Prometheus management starts to break down at scale:
Increased management overhead for SREs and platform teams
Here’s a typical scenario that many users run into: you start out setting up one Prometheus instance to scrape your services, but as you either scale-up the number of instances per service — or scale-up the number of services — the data can no longer fit in a single Prometheus instance. In response, organizations will typically spin up another instance of Prometheus.
However, this results in two separate instances with data split between them, leading to several additional challenges. First, the additional management overhead from sharding. In order to keep the Prometheus instances balanced, you must set up a distributed architecture. This leads to several design decisions, raising questions like: do you shard across services or across service instances?
You also will need to make sure you know how many metrics are exposed from each endpoint and how quickly the number of services or service instances is going to increase in order to split the data relatively evenly.
Reduced productivity — due to cognitive overload — for developers
One of the most critical, yet often overlooked, challenges with running multiple Prometheus instances is that it burdens developers with added cognitive load. Each time a user runs a query, they must first remember which instance to query their data from.
In a system with only two or three instances, this may only add a few seconds, but in an environment with dozens of Prometheus instances, this creates a significant slowdown. On top of that, as you add more Prometheus instances and shard them further, historical data is not transitioned.
The result is that the user may need to look across multiple instances for historical data.
Slower to diagnose upstream/downstream issues due to siloed data
For developers, it’s critical to have a unified and global view so they can quickly debug problems that cross many microservices. Not only do developers need to know where to find their own data and how it’s sharded (see prior point), but if they are debugging an upstream or downstream service, they also need to know which Prometheus instances are keeping those sets of data too.
Unfortunately, when running more than one Prometheus instance, this global view is nearly impossible. The only way to get close to global visibility across all Prometheus instances is to set up an additional federated instance. However, even then, the federated instance can only contain a select subset of the metrics from various instances.
Not only that, but running a federated Prometheus instance is a non-trivial task and is rarely successful.
The risk of flying blind due to lack of high availability of Prometheus monitoring
“Anything that can go wrong, will — at the worst possible moment.”- Finagle’s Law.
Whenever you run Prometheus on a single node, you run the risk of losing real-time visibility — likely at the worst possible time. This may be because the fates are cruel, or because you were running your Prometheus instances with the same dependencies (i.e., same K8s cluster or cloud zone) as your production infrastructure.
On top of losing the real-time visibility and flying blind, potentially during a sev 1 incident, you may also lose historical data if the node completely fails. The recommended work-around is to run two instances to scrape the same targets, however, that leads to an additional set of problems including:
- Inconsistent or flaky results. When querying the two copies of data, there is the potential for discrepancies between the data sets, especially if there is a rolling restart of the instances. For many, inconsistent data is just as bad, or worse, than having no data as it makes the end user question the reliability of the system.
- Increased management overhead, duplicate alerts. In a redundant Prometheus instance architecture, you must set up alerting off both Prometheus instances (in case one instance fails). This leads to more complexity and management overhead cost, since you must configure and manage multiple alert systems that also must deduplicate between each other.
Uncontrollable metrics storage growth in Prometheus monitoring
Monitoring solutions have long used downsampling of historical data as a tactic to both improve storage efficiency and boost query performance. For example, downsampling 30 second resolution data to one hour resolution data for multi-year storage reduces the amount of data stored by 120x. Not only is it vastly more efficient, when querying for multiple years of data, there are only so many pixels on the screen to display the results and even if you had a more fine-grain resolution than one hour, it would have to be downsampled in the browser before display regardless.
Unfortunately, Prometheus monitoring does not have downsampling capabilities built in, which means it is ill suited for long-term storage of data. The storage costs not only grow linearly with retention, but queries requesting data from long periods of time often cause the Prometheus instance to run out of memory and crash due to the sheer size of the dataset being requested.
As a result, most users only store a week or two of monitoring data in Prometheus. This makes it nearly impossible to perform week over week or month over month analysis. Without historical trend analysis, it’s easy to miss big-picture trends and issues — for example ones caused by degradation over time — until significant damage has already been done.
Next steps on your Prometheus scaling and monitoring journey
If any of this sounds familiar to you, it’s important to know that you’re not alone. Many organizations have trod this path before you, recognized the lack of Prometheus monitoring scale capabilities and found better solutions for scaling their cloud-native monitoring. If your organization is already feeling the pains of scaling Prometheus, please get in touch.
Chronosphere allows you to leverage the existing Prometheus and Grafana investments that your team is already familiar with, and takes care of the scaling, visibility and cost issues under the hood. This gives teams the ability to get back to innovating and building, while quickly troubleshooting issues when they arise.
There’s a more effective solution than Prometheus monitoring that grows with you in a modern, cutting-edge tech world. You can have the benefits of Prometheus monitoring at scale in one, centralized service. Get started with Chronosphere for more reliable, long-term, scalable monitoring.
How Chronosphere helps
Decreased Incidents
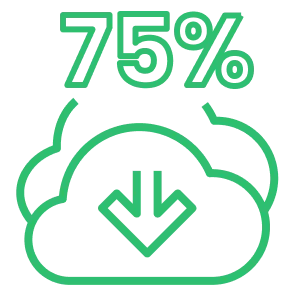
Chronosphere reduced incidents related to poor reliability by 75%, annually

Reduced Costs
Costs were decreased by 40%, by reducing stored metrics
Time Conserved
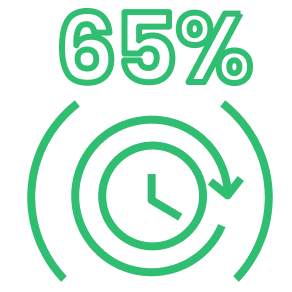
65% less time and resources were spent on observability administration with Chronosphere

Consolidated Tech
Chronosphere facilitated 50% savings on technology costs, by consolidating observability tools
Prometheus FAQs
What is Prometheus?
Prometheus is the de-facto standard for monitoring cloud native environments. As companies shifted to microservices-oriented architecture on container-based infrastructure, companies needed a new way to monitor their data. Backed by the CNCF, it offers a label-based approach to monitoring data that allows users to pivot, group and explore their data along many dimensions.
Prometheus uses a pull-based data collection model, as opposed to applications pushing metrics to a central store, and it has built-in discovery mechanisms to identify what targets to pull metrics from.
Prometheus & Kubernetes
Kubernetes is an open-source system for automating deployment, scaling, and management of containerized applications. It groups containers into logical units for easy management and discovery. Prometheus is the modern standard monitoring technique for monitoring Kubernetes clusters.
What is PromQL?
Prometheus provides a functional query language called PromQL that lets the user select and aggregate time series data in real time. For metrics stored within Prometheus, PromQL (the Prometheus Querying Language) is the way to query and retrieve the results you are looking for.
PromQL is specifically designed for working with time series metrics and makes it easy to transform or compose different metrics together
What are the primary types of Prometheus metrics?
The four primary types of Prometheus metrics are:
- Counters
- Gauges
- Histograms
- Summaries
These metric types are found in Prometheus’ official client libraries: Go, Java, Ruby and Python.
Is OpenTelemetry a replacement for Prometheus?
With the rise of OpenTelemetry, some people are wondering, do we still need Prometheus? The short answer is: yes! Prometheus and OpenTelemetry are both part of the CNCF and are interoperable with each other.
Prometheus is both a standard format AND a storage system and in version 3.0, Prometheus will be able to natively ingest and store OpenTelemetry metrics.


