


What is Data Optimization?
Data optimization is the strategic process of refining observability data to ensure only the most relevant information is captured, stored, and analyzed. Through data optimization, organizations prioritize high-value data points, manage storage efficiently, and reduce the noise of unnecessary data. Effective data optimization doesn’t just control costs; it sharpens insights, allowing teams to focus on what truly matters within complex, cloud-native architectures.
By committing to data optimization, companies transform raw observability data into a lean, powerful asset that drives better decisions, operational efficiency, and overall system reliability.
Cloud native environments emit a massive amount of observability data — between 10x and 100x more than traditional VM-based environments. As more organizations adopt cloud native, this explosive growth creates two problems:
- Observability costs skyrocket and become a significant budget item, often second only to infrastructure costs. To control costs, many organizations are forced to make trade-offs that sacrifice visibility, reduce business insights, and increase risk.
- The massive amount of data leaves engineers drowning in a flood of noise when troubleshooting, ultimately leading to longer incidents that impact customers.
The result is higher costs with worse outcomes, leading to a negative return on investment (ROI).
Chronosphere has led the charge in the industry on the ability to control cloud native observability data. Four years ago we pioneered the revolutionary approach to shaping observability data dynamically, in a streaming fashion, by aggregating, downsampling, and dropping data before it is persisted. Over the years we’ve continued to refine and improve upon what we started so customers can more effectively control their cloud native observability data. This is where data optimization comes into play.
During that time, we learned that shaping data, on its own, is not enough. Working closely with the leading cloud native organizations to manage observability data at scale, a framework for success emerged. We call it the Observability Data Optimization Cycle. It is a vendor-neutral framework, described in detail below.
Chronosphere is the only solution that provides all of the required capabilities outlined in this framework, via our Control Plane, to deliver the best possible observability outcomes at scale while keeping costs under control and maximizing the ROI of their observability solution and practice.
The results speak for themselves. Using our Control Plane, Chronosphere customers have reduced data volumes by 60%, on average — up from 48% a year ago. While this contributes to significant cost reduction, it also enables them to use observability data more strategically, improving business outcomes. All thanks to data optimization!
Some examples include:
- Snap – Reduced data volumes by more than 50% and cut the number of on-call pages by 90%
- Robinhood – 80% reduction in data and improved query latency by 8x and mean time to detection (MTTD) by 4X.
- Abnormal – 98% reduction in data volumes and improved MTTD by 8x.
Let’s take a closer look at the Observability Data Optimization Cycle to see how it can help your company.
The Observability Data Optimization Cycle
How to cost-efficiently deliver the best observability outcomes
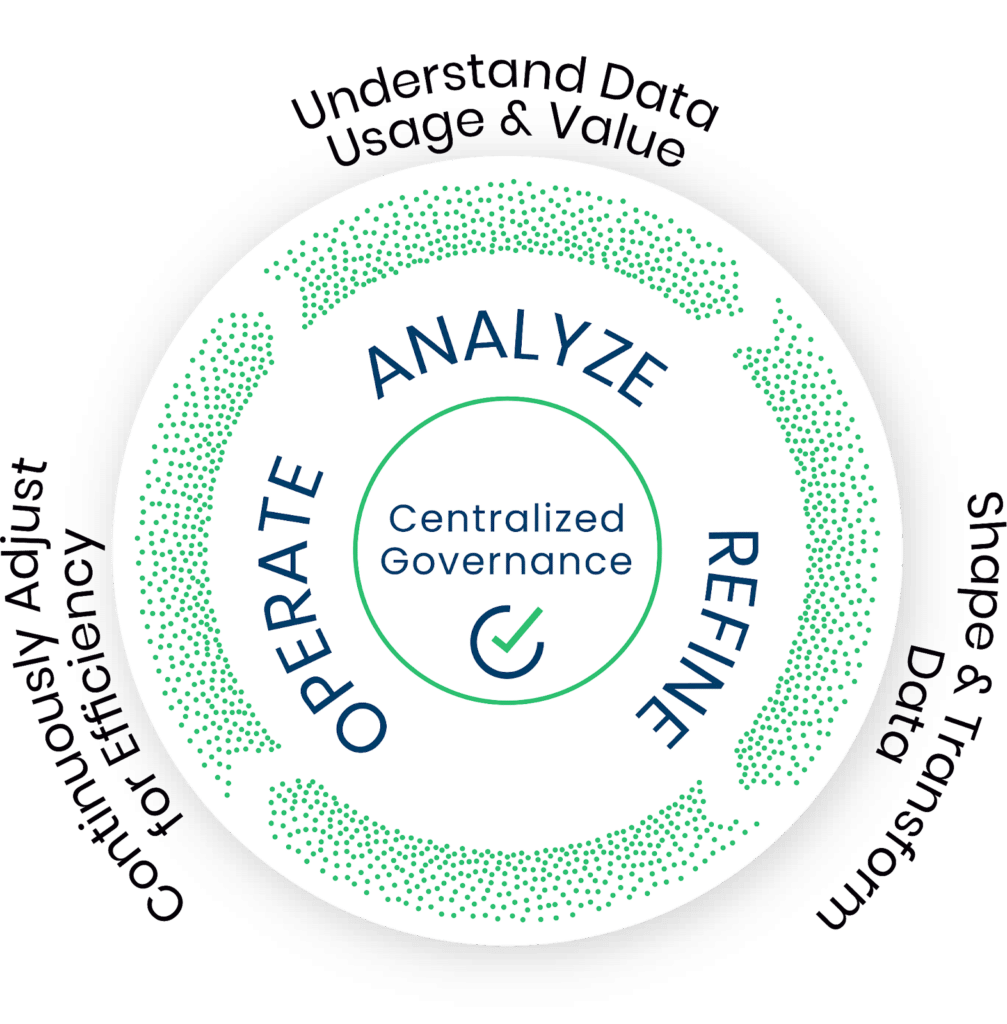
Step 0: Centralized governance: This is critical!
Allocate priorities and drive accountability
Today, the observability team is in the unenviable position of having to play traffic cop and waste their time hunting down teams responsible for sudden spikes and overages in order to control costs and avoid performance issues with the observability system. This is because the teams creating the data have limited insights and few incentives to be proactive about controlling this growth. As organizations scale, it only exacerbates the problem. More and more smaller teams creating more and more data makes it near impossible for the observability team to stay on top of things, so the data volumes and costs spiral out of control.
Observability data costs are becoming a significant budget item and increasingly unpredictable. Everyone needs to understand their usage and take ownership of it to address both these issues. This means performing chargeback/showback, just as infrastructure/cloud costs are done today. Once you have visibility into consumption, you can take steps to make this more predictable, by allocating portions of the observability system capacity, with guardrails (quotas), to these teams.
Regarding consumption, decentralized decision-making is critical because the observability team cannot possibly know what is and is not essential to each engineering team. Each team knows its data best and is empowered to manage usage against its allocated capacity, driving positive behavioral change.
Setting quotas and driving decision-making to the teams responsible for creating the data and data optimization allows centralized governance with shared responsibility to control data growth and predictability. Organizations that skip this step will never be able to achieve a long-term sustainable observability data optimization practice.
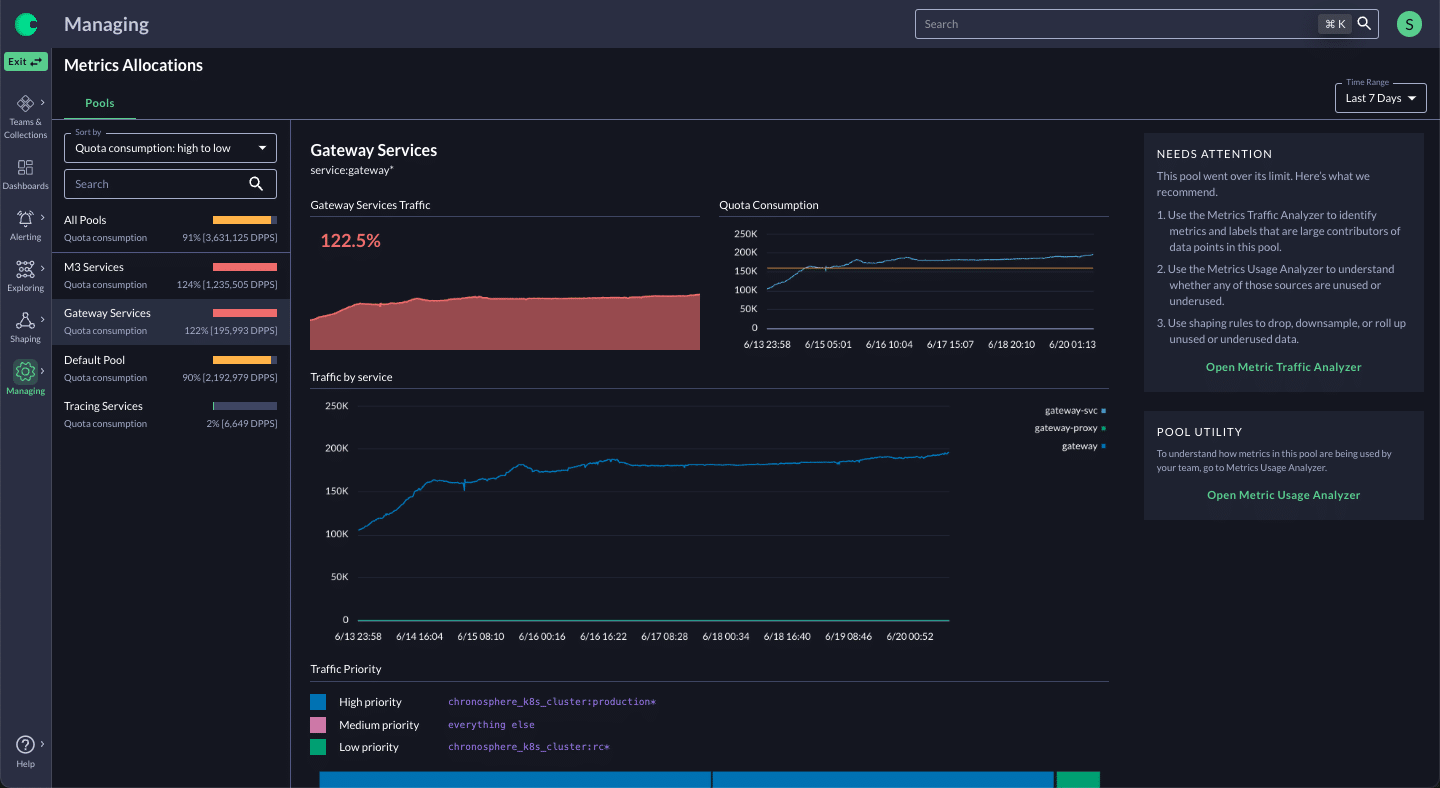
How Chronosphere addresses this: Quotas + Prioritization, Limits, Cost Allocation
Chronosphere enables the observability team to understand how much capacity each team is using, which enables chargeback or showback. The observability team can assign appropriate guardrails to each team using Quotas and Limits functionality. By doing that, not only can the observability team ensure one team can’t crowd out other teams, but they also delegate responsibility for optimization decisions to the service teams themselves.
Quotas can be reconfigured by the observability team based on changing priorities. Each team pre-defines its priorities for how data should be handled if they approach or cross Quota limits. This lets them protect their most important data. Alerts can be set to notify teams when they are getting close to their limit so they can proactively address any capacity issues through data optimization.
Step 1: Analyze
Understand data value and usage
Before taking action on data optimization, engineering teams must be able to analyze the incoming data in real-time to address issues, such as a cardinality spike, currently impacting the observability system. And they also need the ability to understand both the cost and the utility of the data in order to make smart decisions. Just knowing if data is used or not isn’t enough. Ideally, they need to analyze the data and gain an understanding of whether it is useful or not based on characteristics such as:
- Where the data is used – Which dashboards, alerts, queries, etc.
- How the data is used – How is the data grouped and summarized when being queried.
- How often the data is used – To be able to understand access patterns over time.
- Who is using the data – To see how widely the data is being used and to also see what your most experienced engineers are using to find data that would be useful to other users.
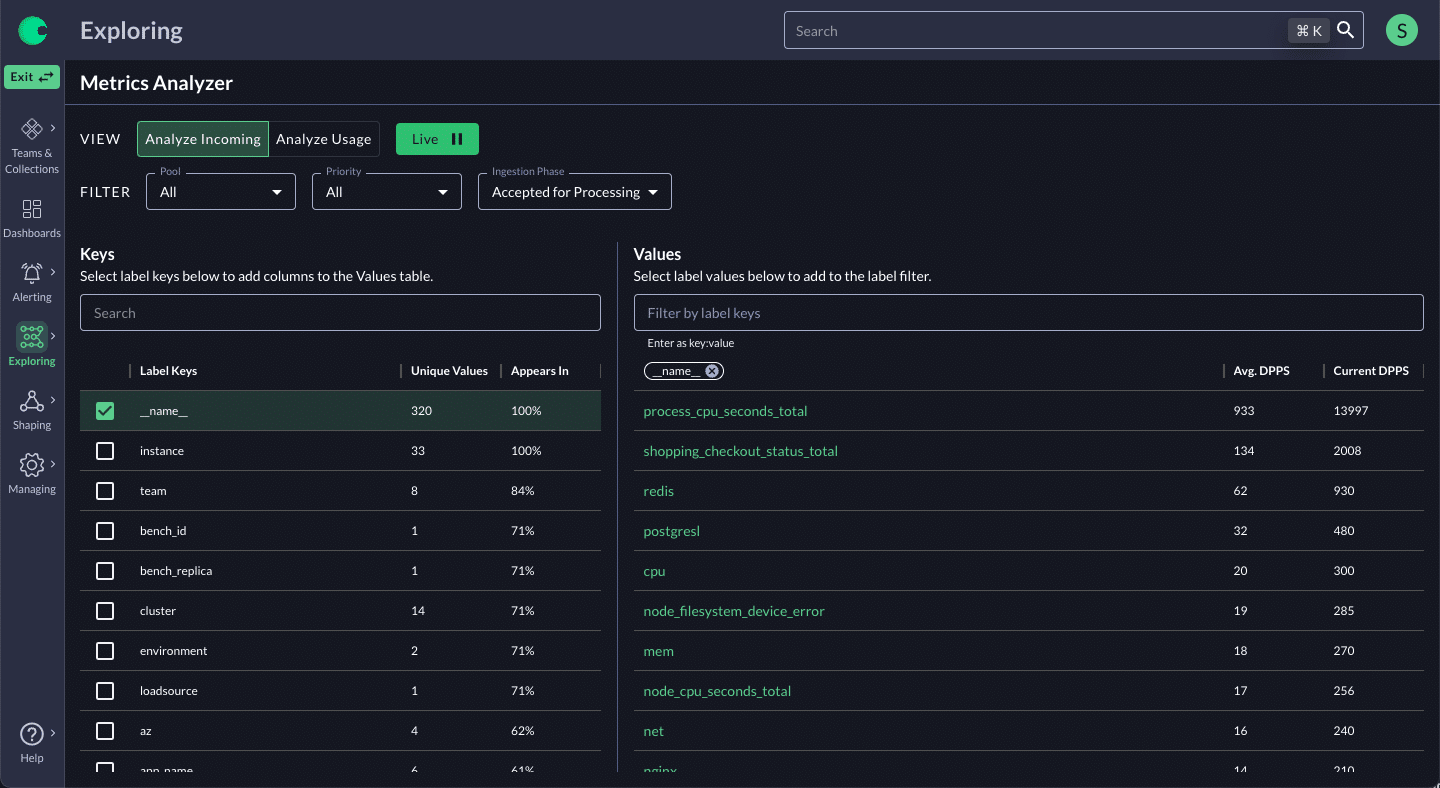
How Chronosphere addresses this: Traffic Analyzer, Metrics Usage Analyzer
To understand the cost, Chronosphere analyzes all the incoming data with our Traffic Analyzer to show teams information about the cardinality and volume of the various data sets in real-time and historically. User can:
- Inspect incoming metrics, in real-time, grouped by label and relative frequency. This is extremely helpful in identifying the source of sudden cardinality spikes.
- Track the cardinality of data over time to alert on changes and identify the root cause of those changes, aiding in data optimization.
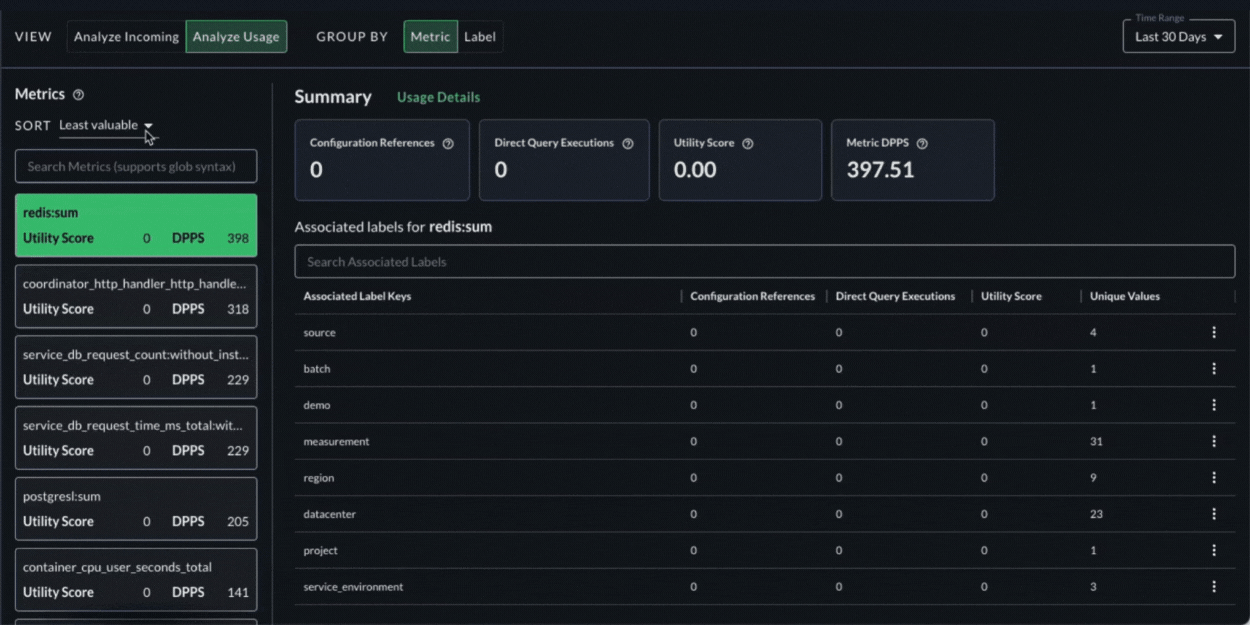
To understand the value, our Metrics Usage Analyzer allows teams to see the cost and value of their data side by side. More specifically it:
- Lets teams slice and dice usage by any arbitrary dimension for fine-grained cost and usage analysis.
- Provides teams insights into how the data is being used, including which dashboards and alerts it shows up in, which specific users are using that data, when, and how often.
- Generates a utility score, based on the usage details above, and ranks the data from least valuable to most valuable.
- This information enables teams to easily identify what is useful and what is not to make smart decisions about how to refine it using Shaping Policies.
Step 2: Refine
Shape and transform data
Once teams understand the cost and value of their data, they can make decisions about how best to refine it in order to ensure the cost and value are in alignment. To deliver the best possible observability outcomes, refining must be more than simply eliminating data to reduce cost. Refining should also include capabilities to boost signal to tilt the scale in value’s favor. Refining policies must include the ability to:
- Aggregate and downsample raw data to optimize cost and boost signal.
- Drop useless data to reduce cost and noise
Because of the dynamic nature of cloud native environments, teams need the ability to do this in real-time, and with precision, ideally without touching the source code or redeploying. They need the flexibility to apply policies globally, as well as address specific use cases to make refining manageable at scale, and not take copious amounts of developer productivity away.
How Chronosphere addresses Shaping Policies
Chronosphere enables teams to shape all data by default using either a global policy or specific policies per application, team, or arbitrary filter. This makes it feasible for teams to manage data at scale instead of writing rules for each individual metric name like other solutions. They can roll away entire dimensionality from all data or subsets of the data as needed without any active management required, whether by environment, type, team, or service-by-service.
Chronosphere provides multiple Shaping Policy options to reduce, transform, and amplify data. Examples include:
- Aggregate – Aggregate and downsample moderately valuable data into higher-value versions with better performance. Teams have the option to drop the unused raw data to reduce costs.
- Drop – With a single policy, remove labels that drive up cardinality but don’t add value, like podID.
- Amplify – Using derived telemetry, organizations can store complex, high-value queries under user-friendly names. These straightforward names are accessible for even brand-new developers to find and use to power their dashboards and alerts.
Application of these policies is done in real-time at ingest (streaming), which means teams have no delay in alerts and don’t need to store the raw data. Teams have the option to preview the impact of any new or updated shaping policies before they are implemented.
The result is reduced cost and improved performance, and best of all the end users don’t see a difference in their dashboards, alerts, or queries.
Step 3: Operate
Continuously adjust for efficiency
In a large-scale cloud native environment, the rate of change is massive. Over time, the effectiveness of refining policies can change due to the changing dynamics and changes in use of observability data collected. Teams need insights into how effective their refining policies are, so they can make adjustments when necessary. Without this level of transparency, teams can’t ensure they are using their assigned capacity/quota efficiently and the organization won’t be able to maximize the ROI of their observability practice.
How Chronosphere addresses Shaping Policy Configuration, Shaping Policy Impact, Query Accelerator
Chronosphere’s Shaping Policies UI makes it easy to identify policies that have become inefficient. It also shows how each policy is configured and how it is performing. The Shaping Policies UI allows users to easily see detailed information about a policy, including the platform resources a policy consumes, how efficient it is, how much it contributes to storage, the change in the contribution, and when it was last modified.
To ensure fast-loading dashboards and alerts Chronosphere’s Query Accelerator continuously scans for slow queries and automatically creates a refined alternative that delivers the same results but with much faster performance. As a result, engineers no longer have to manually optimize queries or be proficient at writing “good queries.” They can create a query that returns the data they need, and Query Accelerator will ensure that it performs optimally wherever it’s used. This reduces toil and makes troubleshooting faster by ensuring that the data engineers need to manipulate during their debugging process are quick and responsive. 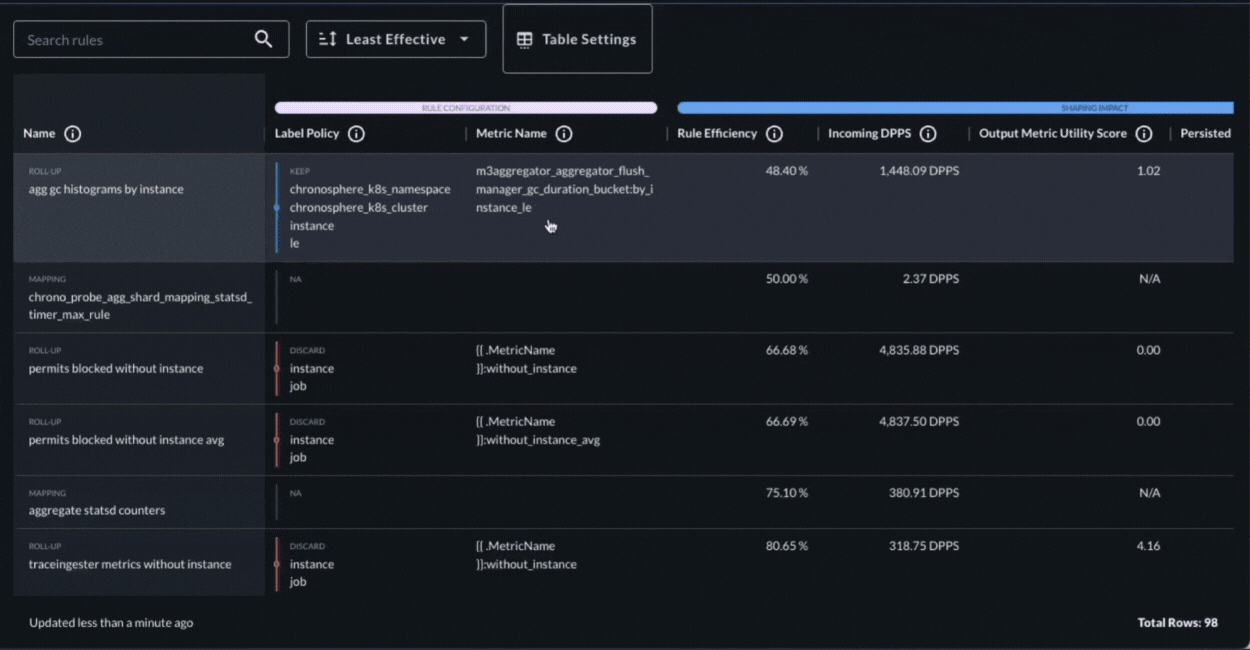
Benefits of adopting the Observability Data Optimization Cycle framework
According to a recent study by ESG, 69% of companies are concerned with the rate of their observability data growth. Implementing the data optimization framework effectively will allow any company experiencing the cloud native observability data explosion to significantly improve the amount of data they store while improving the usefulness of the data for their engineers.
With observability data costs and growth right sized and under control, the organization can use the budget and time savings to do more and move observability from a cost center to a source of competitive advantage, further improving the ROI of their observability practice. Examples of ways organizations can uplevel their observability practice when they are able to control and optimize their data include:
- Expanding visibility and coverage
- Get more detailed information about your most essential business applications to improve troubleshooting efforts and gain more insights.
- Expand coverage and reduce the need to make tradeoffs based on budget constraints and know that this expanded coverage is efficient and adds value using the data optimization framework.
- Increasing the use of custom instrumentation to improve business outcomes
- Instrument the customer experience to gain real-time visibility into the business. This view of the business is required as there is no longer a 1:1 mapping to a single application’s endpoint.
- Enable A/B testing and fast experimentation leading to faster iteration of features and identification of new business opportunities
- Start tracking end customer SLAs and have those inform the service SLAs
- Freeing up more of the observability team time to tackle strategic projects
- Create standardized out-of-the-box experiences for all developers:
- High-level auto instrumentation of new services and endpoints
- Standardized SLA and SLO definitions for all services
- Ensuring tight integration across the telemetry data types to optimize the debugging workflow
- Iterate and provide more advanced Observability functionality like anomaly detection and auto-rollbacks
- Create business health dashboards that give an overview from the top-level business, down through the critical services that power it and the infrastructure it runs on
- Create standardized out-of-the-box experiences for all developers:
Summary
The new world of cloud native makes controlling data based on the value it delivers, not just cost, a requirement to ensure the best possible observability outcomes. The best observability outcomes extend to more than just identifying and remediating issues quickly. They include using observability data to uncover new business opportunities, generating insights that help to improve the customer experience, etc. Cloud native opens up the opportunity to use observability data in entirely new ways, not possible with previous architectures.
The Observability Data Optimization Cycle outlines what is necessary to move your observability practice from a cost center to a source of competitive advantage. And Chronosphere is the best solution and partner to help make that happen.
Learn more about Observability by downloading our O’Reilly ebook on cloud-native observability today.


