
Whether you’re an enterprise migrating to cloud native or born in the cloud, most of today’s application performance monitoring (APM) and observability tools don’t support how your engineers and DevOps teams need to develop, deploy, and support their software. Observability needs to shift left and reflect the modern way companies organize their development teams and their vital interdependencies.
In this webinar, Chronosphere Director of Product Marketing, George Hamilton, sits down with our Director of Technical Marketing & Evangelism, Eric Schabell, to talk about the idea of shift left observability and how it’s time to start focusing more on how to make engineers more productive — and less burned out — in a cloud native world.
For those that don’t have a half hour to watch the webinar, we’ve detailed much of their conversation below:
Current cloud native aches and pains
George kicked things off by explaining how we are at an inflection point with observability and how we got here. He walks through the journey from on-premises “up or down” monitoring to the cloud era with dozens of services running on hundreds to thousands of virtual machines (and the premium placed on performance and SLAs) to present day’s complex cloud native architectures.
George: We’re at a really interesting point — where it’s not just dozens of applications running on hundreds or thousands of virtual machines. It’s thousands of microservices running on millions of containers in some environments. And now the question is, “What is my customer and end user experience? How do I know that?” Today, things are so much more complicated.
Cloud native is popular but complex
George: We’ve adopted cloud native for a lot of good reasons. We want speed, we want efficiency, we want to innovate faster … but now, everyone’s environment is much more complex than it has ever been. Infrastructure is running on containers. They’re ephemeral, they scale dynamically, and they have very unique operational challenges. On top of that, your applications are all built on microservices, which have many more interdependencies. And crucially, there’s likely no single person in your environment who knows how all of this fits together.
Even though this is giving you a lot of agility — being able to do things quickly and dynamically — when there is an incident that pops up, it is nearly impossible to figure out where to go to fix that problem. And this is despite the fact that you have access to more data than ever, because each container microservice is emitting as many metrics as a single monolithic virtual machine-based application.
The impact of cloud native on technical teams
George: As a result, on-call developers who maybe aren’t familiar with the scale of complexity, don’t know where to begin when something comes up. You can see that there is so much data to sift through, and engineers from all parts of the organization get pulled away from their day job to troubleshoot it.
Your central observability team (COT) is trying to support the engineers, but they’re dealing with other problems like dashboards that are slow, queries timing out, or availability of the observability system itself is a problem. Perhaps your app goes down and your observability system is hosted on the same cloud or the same region. Now all of a sudden, you have no app and no visibility … you’re flying blind. The majority of the time the COT is maintaining the observability system itself.
The business owners, of course, get upset. They’re looking for answers and they want it immediately. And more importantly, your customers are getting pretty annoyed, or you have something that affects revenue.
This has a huge impact on your technical team, on your customers, and on your business. You can lose revenue, customer churn, all those things. And of course, you’re spending a lot of time with engineering toil — engineers are doing a lot of work just to keep the lights on. This is an age-old problem and the cost gets higher.
How did we get here?
George: Observability was supposed to help with a lot of this.
The problem is that when you started using APM — or maybe you’re just getting started with a Prometheus-based solution — the cost of your observability solution was probably in line with the value that you were receiving. But the cloud native problem is starting to throw this equation out of whack.
The data volume is driving up your costs substantially, and you’re not fixing problems faster. In fact, it’s just taking longer because more data isn’t always better. It can slow you down, it can make it hard to find what’s important .… you’re actually driving down the value that you’re getting from your observability platform. There are some interesting stats to back that up:
- A 2021 ESG report found seventy-one percent of the companies that they interviewed were at least concerned about the growth of their observability data.
- PagerDuty found that almost seventy percent of companies actually saw an increase in customer-facing incidents in the past 12 months.
What it boils down to is two primary things:
- The volume and complexity of data is overwhelming.
- Whether we’re talking about legacy application performance monitoring, some cloud monitoring solutions, Prometheus — whichever your approach is — the available tools today really aren’t supporting the workflows that are emerging as organizations build and support a microservices-based architecture.
So, let’s drill into each of these things. Eric, we’ll start with you in talking about firstly the volume and complexity issue.
How to shift left
Eric: You’re getting buried in what’s going on. The idea is that you don’t mind spending more money or having more data. You don’t mind more tools if all of that would result in better outcomes — which it’s not doing. It’s about time that we start getting a little bit more of our time back. We want to have more focus, we want to see a little bit more “Dev” than “Ops”. All of our engineers need to be back on engineering tasks and not tracking down what’s going on in that great pile of data …
Everything seems fairly controllable with APM tools. But, then all of the sudden, cloud native explodes on the scene. Each one of these phases from the business to the application to the architecture is just a multitude of more. It’s not something you’re able to control either — because, remember that cloud native environments are based on Kubernetes … which means it scales dynamically, not always within the confines of what your budget might be or what your monitoring capabilities were expecting as the flooded data comes in. This results in a lot of these large bills.
Because of its unexpected expansions, you don’t have the control mechanisms in place. Also, the reason you see the focus on financial operations (FinOps) roles is so that somebody owns the expense aspect of what’s going on, and it’s not just sprinkled around the organization where everybody’s making decisions on their own.
Managing cardinality
In a cloud native environment, when it starts expanding and scaling automatically, this runs into some huge cardinality issues. If you don’t have observability mechanisms in place, or the ability to predict what is going on, you’re getting the bill at the end to find out what happened; that’s not really how you want to explode your budgets.
Most organizations around the world currently are keeping their metrics and observability data for a minimum of 13 months. You can imagine if you’re running thousands of these, or millions of these, the amount of data that you could be forced to pay for. The tool sprawl also means that the workflows become very disjointed from what’s going on in the organization. Over time, you just end up generating an infrastructure environment for your observability that’s technological bandages. It’s like putting band aids on a leaking dam. It’s a pretty frustrating environment for anybody.
Both George and I know someone here that we’ve been in contact with that has burned out six times in these kinds of roles. You get helpless when you don’t even know what your next job is going to be – and you think you’re stepping into the same stuff again. It’s not the way to go.
Catch up on the rest of this answer at 13:40
The workflow impact of cloud native
George: All these band-aids we’re trying to apply to catch up to cloud native really hurts the teams. Development used to be fairly simple, ownership was fairly simple. A team would essentially own an application from top to bottom … no such thing exists in the cloud native world. It’s all on the fly, an amalgamation of independently owned and operated microservices. Increasingly, organizations are setting up their dev teams to map to this new reality … things are a lot more democratic … [but] entropy has become a huge issue in a lot of large scaling environments and makes finding the right data nearly impossible.
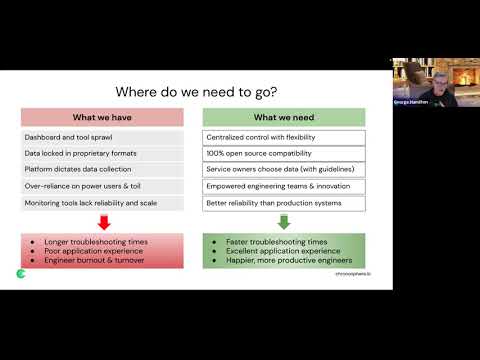
We have dashboard and tool sprawl, which is still a very persistent problem. The operation of APM tools, some observability tools, control what data you can collect and put it in the context of their tooling.
You also have overreliance on the power users, which adds a lot of toil. You can’t spend time adding new value, adding features to things, and you have a reliability issue. When the observability system is down at the same time as the application – they’re flying blind. This is a huge issue for [engineers]. It costs them money, it costs them engineering time … troubleshooting times are longer and engineers get burned out.
What you really need is to have much more centralized control with some flexibility … you want to have a system where users can curate what’s important about an application or microservice to them and share it broadly through the organization while the central observability team can wrap some guidelines and guidance around that.
Catch up on the rest of this answer at 18:40
The power of the right cloud native observability platform
George: Cloud native complexity is overwhelming. Your cost to value ratio gets totally out of whack. Chronosphere gets you back in control of that … you should be able to get these costs under control, improve your visibility, and be able to find the right data to solve a problem. We swing that cost value equation back into your favor. You’re collecting all of the same data, but it’s aggregated and transformed.
We shape that data so that you actually only have the data that gives you actionable insight into something that is usable for developers, while being much more efficient and much more cost effective; improving mean time to repair (MTTR), and in turn happier customers. You can still have this democratization in observability, but reduce toil and keep your engineers focused on innovation and your observability costs will actually go down.
Eric: What is really interesting is that the narrowed focus leads you through the solution space. The investigation doesn’t include jumping around to a bunch of different tools — it’s taking you from where you started with the actual monitoring alert, down into the problems you’re looking for. That’s a really big difference from what you’re usually seeing in the second generation.
George: It’s all about putting data in context and socializing all of that kind of domain knowledge that is in the head of your power users and being able to socialize that to the rest of the organization, so that less-experienced engineers don’t have to escalate as frequently, and can go in and resolve issues much faster.
How do we do that? We’ll show you how we shape data to reduce the data volume, without negatively impacting your key metrics, and also how we support engineer workflows and map to your organization.
Take back control with our Control Plane
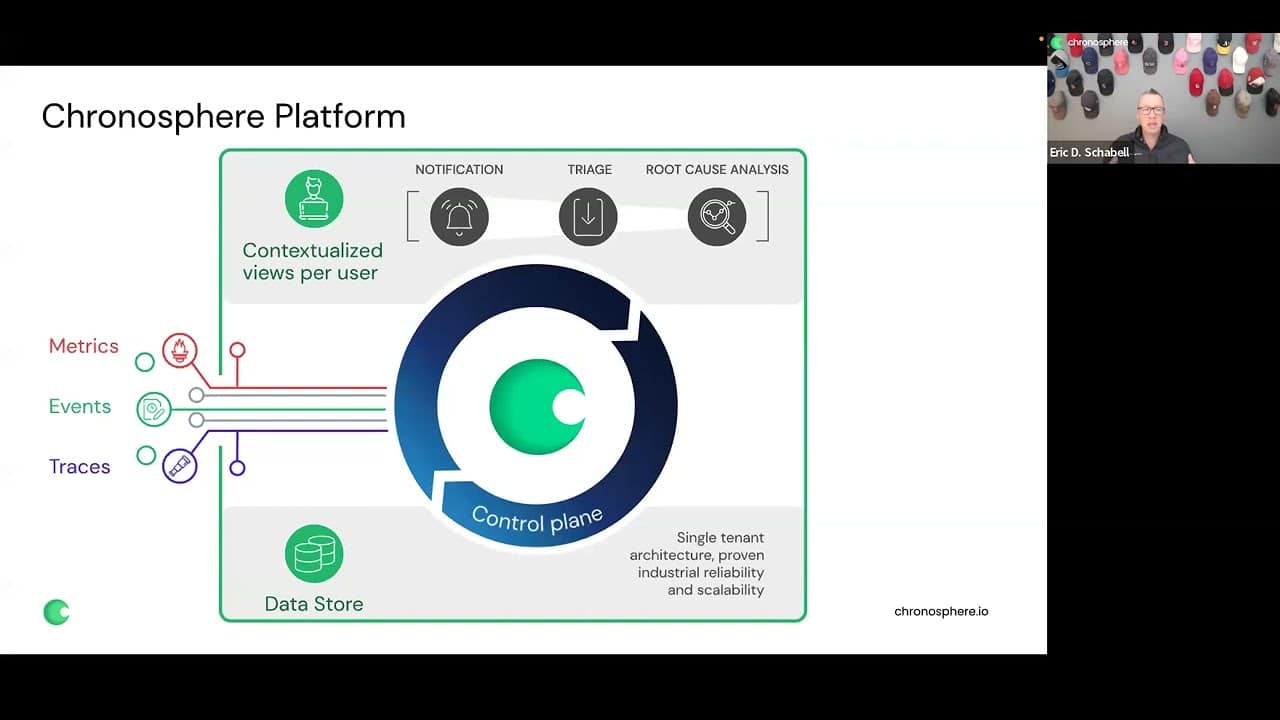
Eric: Keep in mind the things that are really interesting — how you ingest data, and keeping that open source and open standards; that’s the big key right there. You’re also looking at the amount of storage you’re going to use, the dashboarding you’re creating, and alerting. What you see here [clip below] is metrics, events, and traces using open standards. Things like PromQL are used around dashboarding and alerting. The first thing that happens after collecting that data, is you have the Chronosphere Control Plane.
This Control Plane is what puts the dials and buttons in your hands … You have the ability to use rollup rules or drop rules, and aggregate. You can decide what you want to keep. The nice thing is that you’re doing that at ingestion time — which means that data hasn’t been stored yet, which is immediately reducing the cost.
One of the numbers that we like to quote a lot is that about 50% of this data is, on average, what we save for any customers that go onto this platform just because they’ve never realized they don’t have the ability to easily do that. So, being able to take the Control Plane to downsample and get back control of your own data for specific needs and to put it into your dashboards — that is a superpower.
Eric: The entire idea of Chronosphere’s platform – contextualizing data per user – is based on these principles: You want to know as fast as possible when something is going wrong. You want to be able to triage the problem. Within those two steps, you want to remediate. You don’t want to lose information or not have the ability to later do root cause analysis and deeply understand what went wrong so that it doesn’t happen again.
That’s the path that you’re being led down. That is what drives every conceptual view that a user is doing. [It’s all about]: “I need enough data to get to the right notifications. I need enough data to triage. I need to be led through that process without having to jump around to a bunch of different tools or dashboards. I need the ability to drill down far enough to know the right person to give that information to.”
Support shift left observability with Chronosphere
George: Our own data points around our existing customers was that they spend about 50% less time troubleshooting. They are getting to remediation much faster. On average, Chronosphere customers reduce their data volume almost 50% Some have reduced their data volume by much more than that. Some customers say 70-80% — which means that they were inefficient before, but made remarkable changes and improvements in their troubleshooting with less data. They don’t have to sift through a bunch of data that doesn’t matter.
The last point is that the four nines are historically what we’ve delivered. It’s one thing to promise a service-level agreement (SLA) — it’s another thing to deliver on it. A lot of vendors promise SLAs, and you get a credit at the end of the month for the downtime that didn’t help you with the problem and impacted your customers. You can go onto the vendor’s websites and they will publicly post any issues that come up.
You’ll find that the majority of the time, they’re around 99.5%. That’s a lot of time each month. We have historically delivered four nines to our customers. The reliability is a huge component — that is feedback directly from our own customers.
Data, data, data (and cost reduction)
George: We’ve talked a lot about the data volume piece and being able to get the right data and reduce your costs. [At Chronosphere] we don’t charge for data ingest, we only charge for persisted storage. That’s very disruptive in the market today, because most vendors will charge for data ingest in addition to storage and don’t have the mechanisms to filter out a lot of the stuff that you don’t need.
Secondly, we announced at KubeCon a new release of our software that really gets to the engineer burnout problem. A key new feature that we announced is called Workspaces & Collections.
Using Workspaces & Collections, customers can align their organizations in their workflows within Chronosphere. You can think of Workspaces as your views into the environment. It orients you as an engineer so you can work more effectively. Your Workspaces can be global — which is a view of the entire system or at the team level.
George: A collection is an organizational construct where teams can store everything that is relevant to a service. Collections let the expert on the team build the default view of a microservice. Then, that view is shared with everyone else in the organization. Because I have a global view, I can see all the other teams and their collections, and what they’ve curated. It puts the power in the engineers to curate dashboards, monitors, and other artifacts that are associated with a microservice, and curate them into a Collection.
Workspaces & Collections work together to provide context for engineering teams so that engineers can more quickly navigate to the data that is a relevant issue. Again, less reliance on power users frees them up to do more innovative, valuable things rather than just coming to the rescue of a less-experienced engineer.
The value that [Chronosphere] delivers is being able to control and shape your data; the reliability of the platform being more reliable than your infrastructure; and Workspaces & Collections putting the right data in the right context at the right time.
Want to hear the full conversation? Watch the webinar to learn how observability helps with engineering burnout. Continue at 32:15.


