Distributed Tracing for All
CONTROL COSTS AND TROUBLESHOOT EFFICIENTLY
A different approach to tracing: Dynamic sampling capabilities to manage trace volumes matched with a streamlined, queryless troubleshooting workflow that makes it easy for all developers to quickly pinpoint the source of performance issues.

Distributed Tracing Key Benefits
Faster Remediation
Automatically surface critical insights from trace data using Differential Diagnosis (DDx) to identify the likely source of service slowness or failure.
Trace insights with contextual linkage between metrics, logs, and events makes trace data more useful.
Control Costs
Dynamic sampling allows you to “turn up” sampling rates during an incident and back down when the issue has been identified.
Prioritize trace collection based on how critical the operational workflow is to the business with Datasets and Behaviors.
Increase Efficiency
Designed to make it easy for any developer to effectively troubleshoot issues. No system knowledge or query language expertise required.
Streamlines troubleshooting by eliminating the need to escalate, improving overall team productivity.
No Vendor Lock-In
100% compatible with OpenTelemetry, Jaeger, or Zipkin.
Ingest trace, metric, and log data via the native OpenTelemetry Collector or the Chronosphere Collector.
Distributed Tracing Features
Differential Diagnosis (DDx) for Traces
FIND WHAT'S SLOW, OR BROKEN, QUICKLY
Modern systems make it hard to spot what changed or what’s causing slowness.
DDx for Traces removes the guesswork by automatically analyzing all spans and attributes related to a trace—highlighting what’s correlated with a performance issue and what’s not.
With a guided, queryless workflow, anyone on the team can follow a clear path from symptom to cause and validate hypotheses quickly—no system deep-dive or prior context needed.

Trace Control
ENSURE YOU HAVE THE TRACE DATA YOU NEED, WHEN YOU NEED IT
You can’t egress, store, and query every trace—it’s too costly. So how do you avoid missing key traces?
The Trace Control Plane provides centralized sampling tools to ensure you only capture and pay for valuable trace data.
Use Datasets to group traces by service flow, and apply Behaviors to manage sampling rules without manual overhead.
Dynamic head and tail sampling allow you to set a low default sampling rate for cost control, then dynamically increase them during incidents for critical services—no redeployment needed. This ensures high visibility when it matters without breaking the budget.

Trace Explorer
Trace Explorer has features for everyone - From the intuitive DDx workflow built for all developers to advanced capabilities for power users.
The Query Builder allows for broad or pinpoint searching for specific patterns, such as traces making more than 100 calls to the same endpoint.
The Statistics tab empowers high-scale aggregate analysis across all relevant data.
Change Event overlays allow you to easily correlate events with changes in system performance.
The Topology View allows you to view all dependencies. You can group and narrow results on the map, such as error, and identify spans in the critical path to hone in on the source of latency.

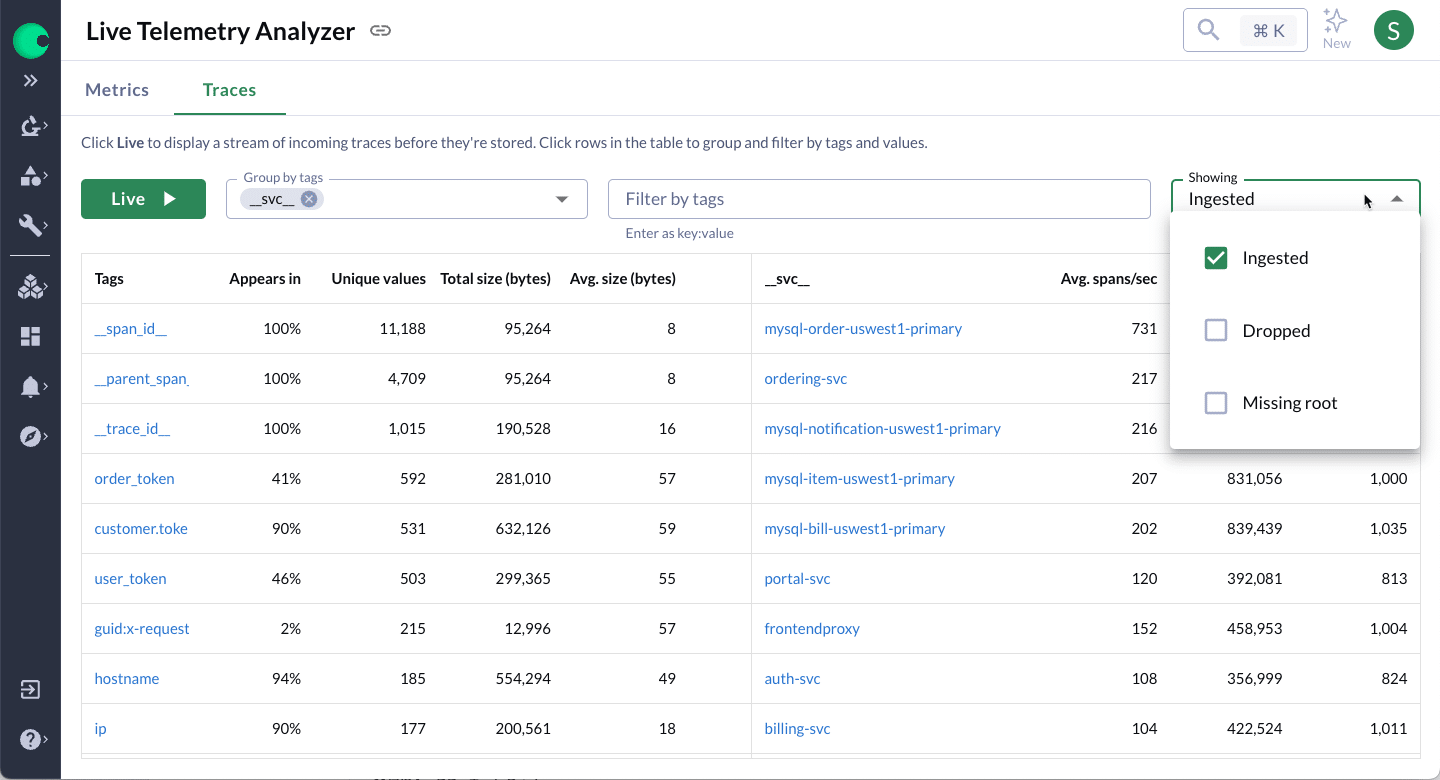
Live Trace Analyzer
Live Trace Analyzer provides a real-time view of incoming traces grouped by tags and their relative frequency. Use this information to help understand how often your applications emit traces and troubleshoot spikes in ingest rates.
Trace Metrics
Alert and/or create dashboards by generating a new metric data point based on an entire trace or part of a trace. Trace metrics can be generated in seconds without re-instrumenting your application.
Use them to capture errors on specific high-cardinality dimensions that might get buried or rolled-away by traditional Prometheus metrics.

Distributed Tracing Docs
")