Chronosphere Logs
Control log data volume without compromising visibility
Identify the data that matters and remove the noise to reduce costs and speed up insights – all while unifying MELT data in one place.
We Power Observability for the Most Demanding, High-Volume Workloads
Take Control of Log Data Growth
Chronosphere Logs transforms log management in containerized, microservices environments
Control Data Volume and Cost
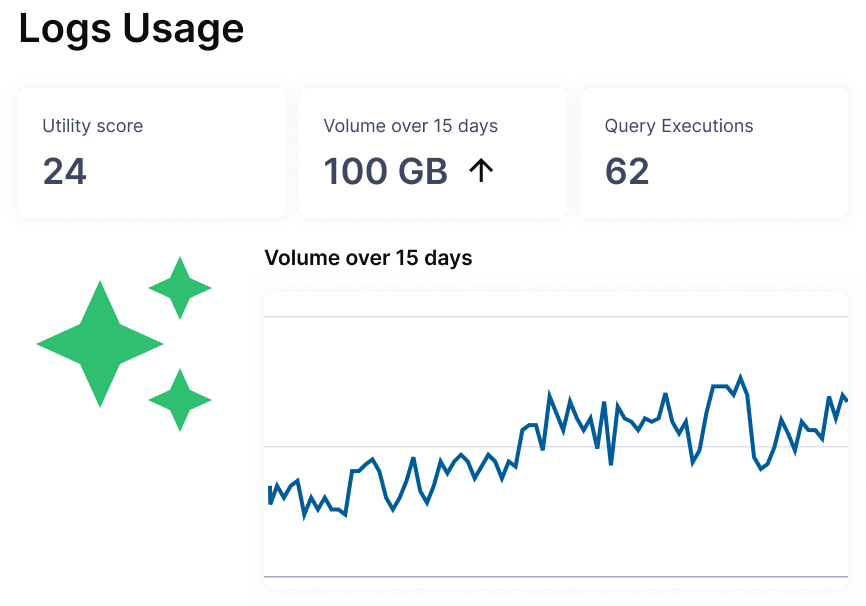
Align costs with business value. Understand log utility and get smart recommendations on how to reduce noise. Now, you can identify, keep, and pay for the only data you need.
Gain Performance & Reliability at Scale
With historical 99.99% uptime and consistent performance regardless of data volume, you can investigate issues across any time range without compromising speed or reliability.
Consolidate Fragmented Tooling
Analyze all telemetry types – logs, events, metrics, and traces – in one unified interface. Eliminate context switching between tools to dramatically reduce troubleshooting time.
Logs Features
Pay to Store the Signal, Not the Noise
- Understand the volume and utility of your logs – which data your team uses and how – to anticipate growth and inform reduction
- Receive proactive recommendations to reduce data while preserving its analytical value
- Allocate capacity based on business priorities and empower individual teams to control their own data strategy
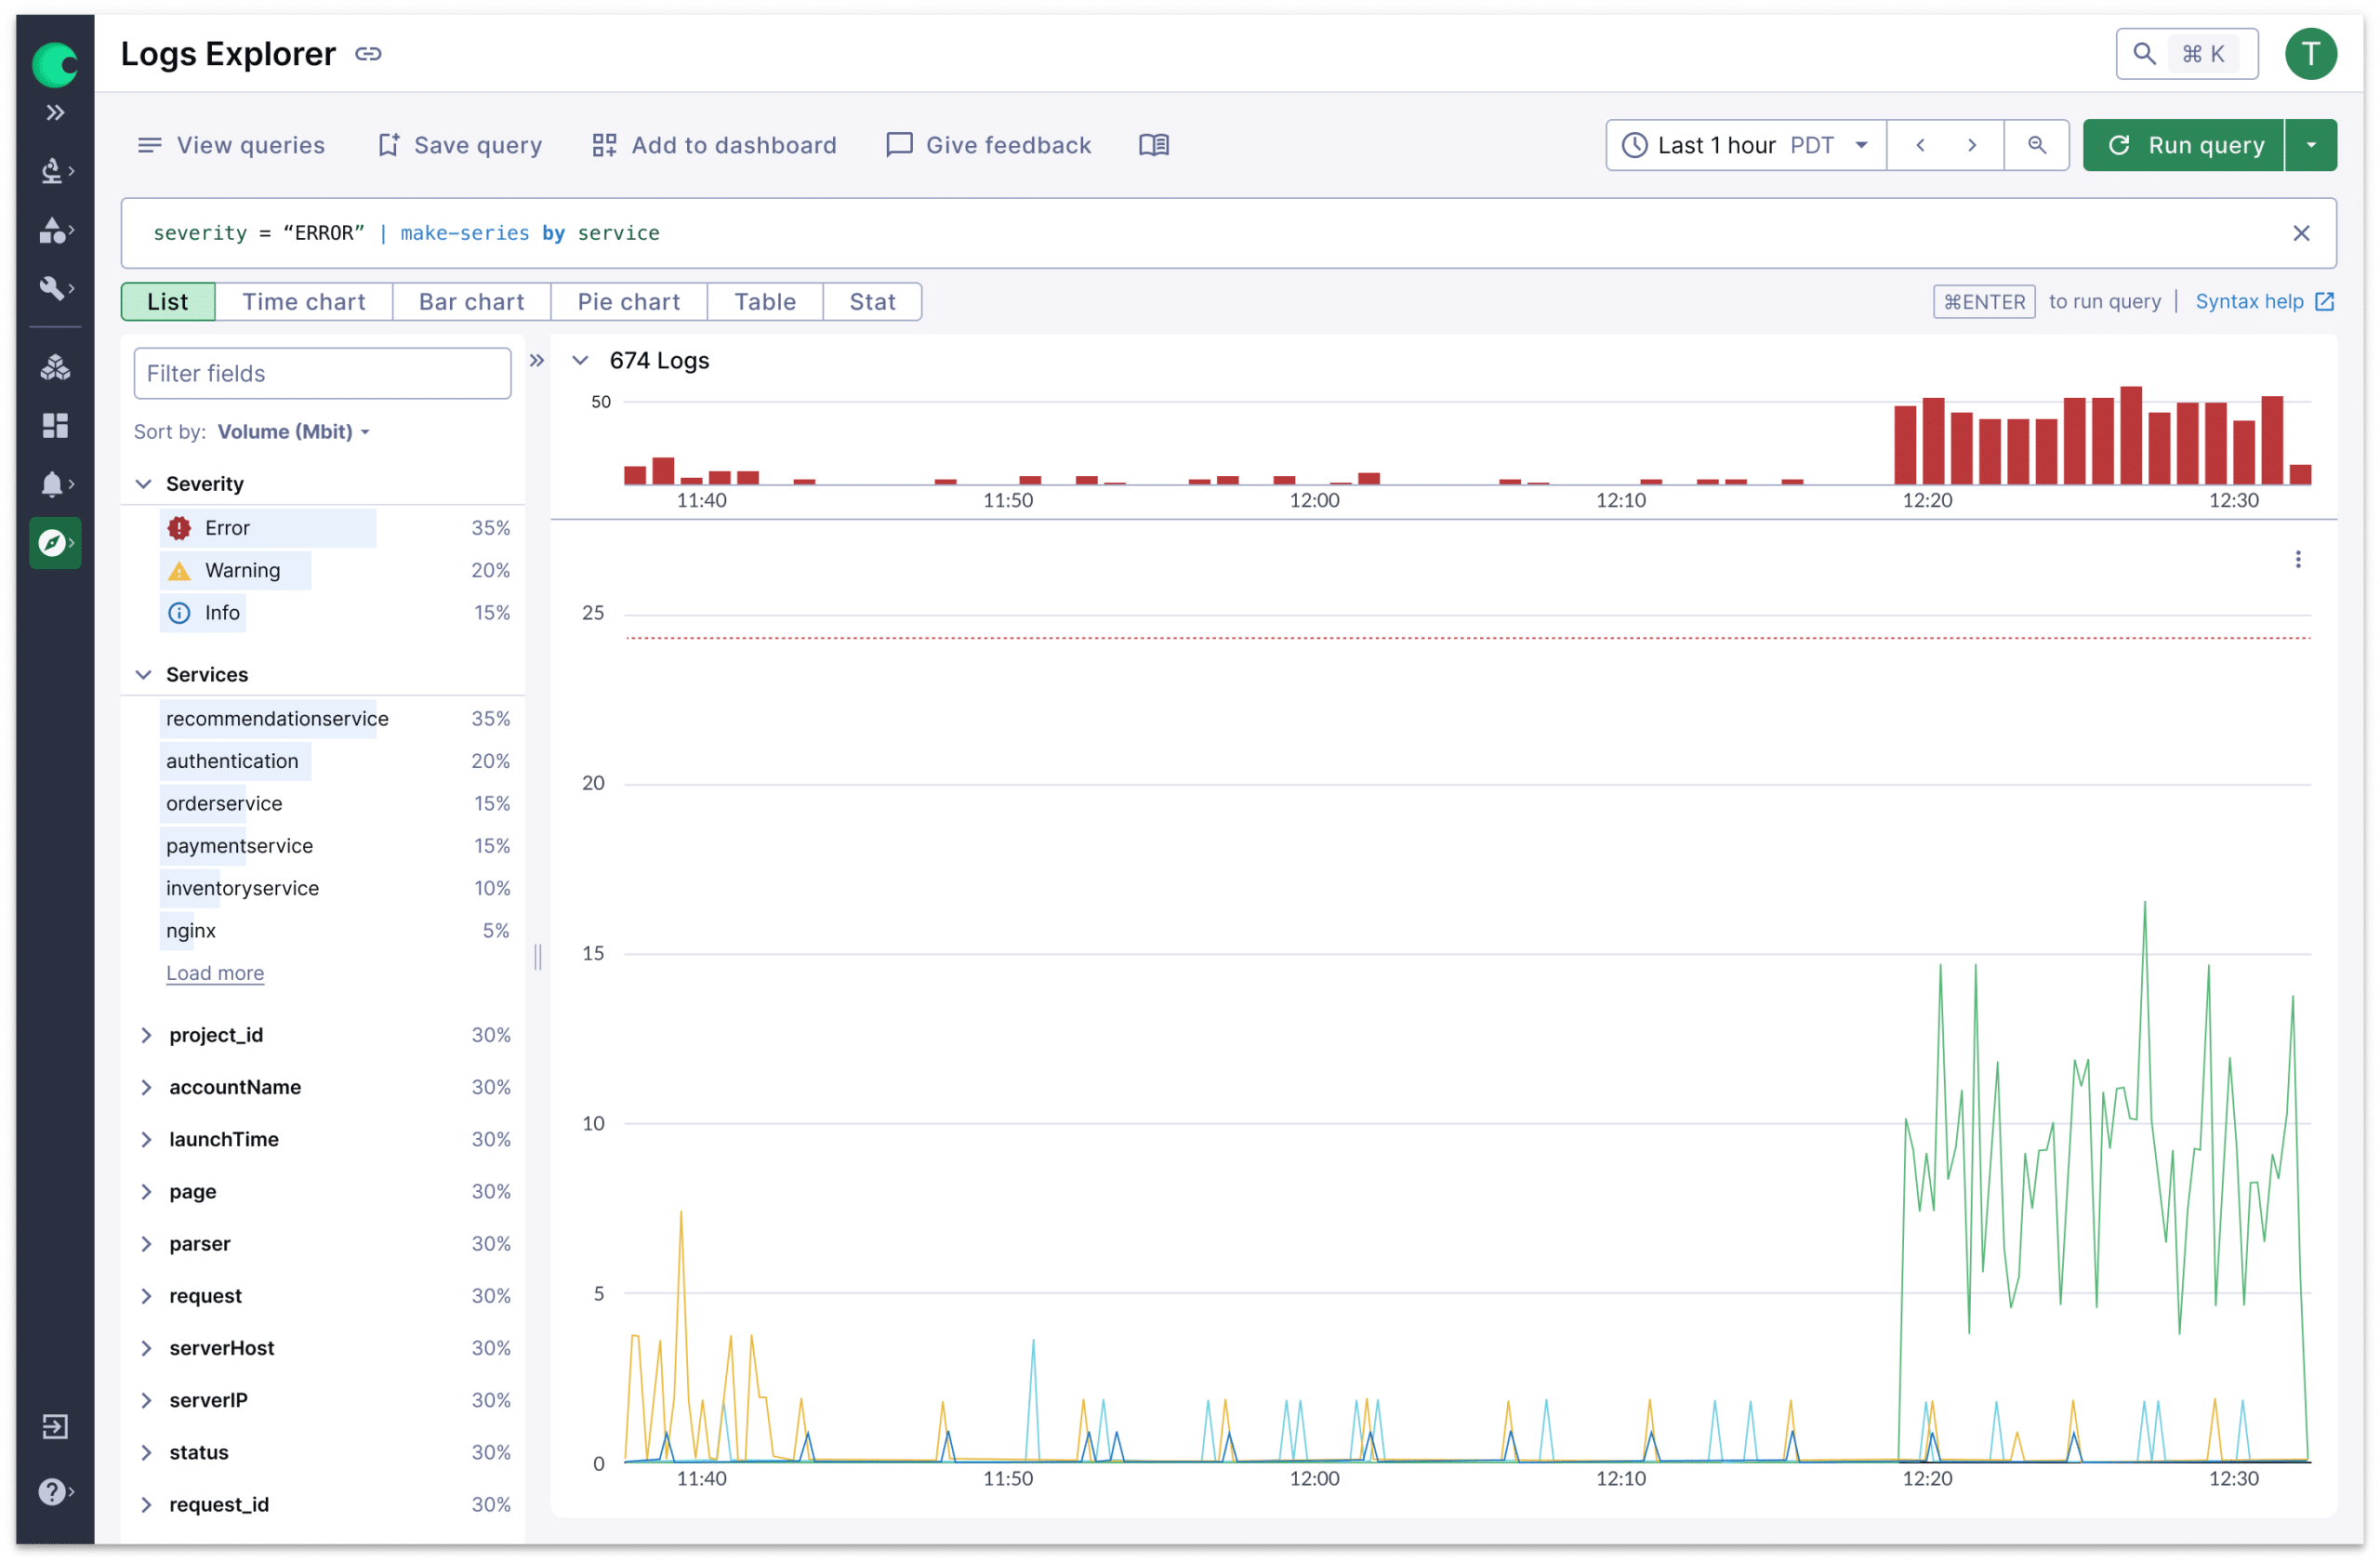
Query Like an Expert from Day One
- Start investigating immediately with a familiar syntax, based on open standards
- Easily learn advanced queries with a transparent builder that shows exactly how searches are constructed
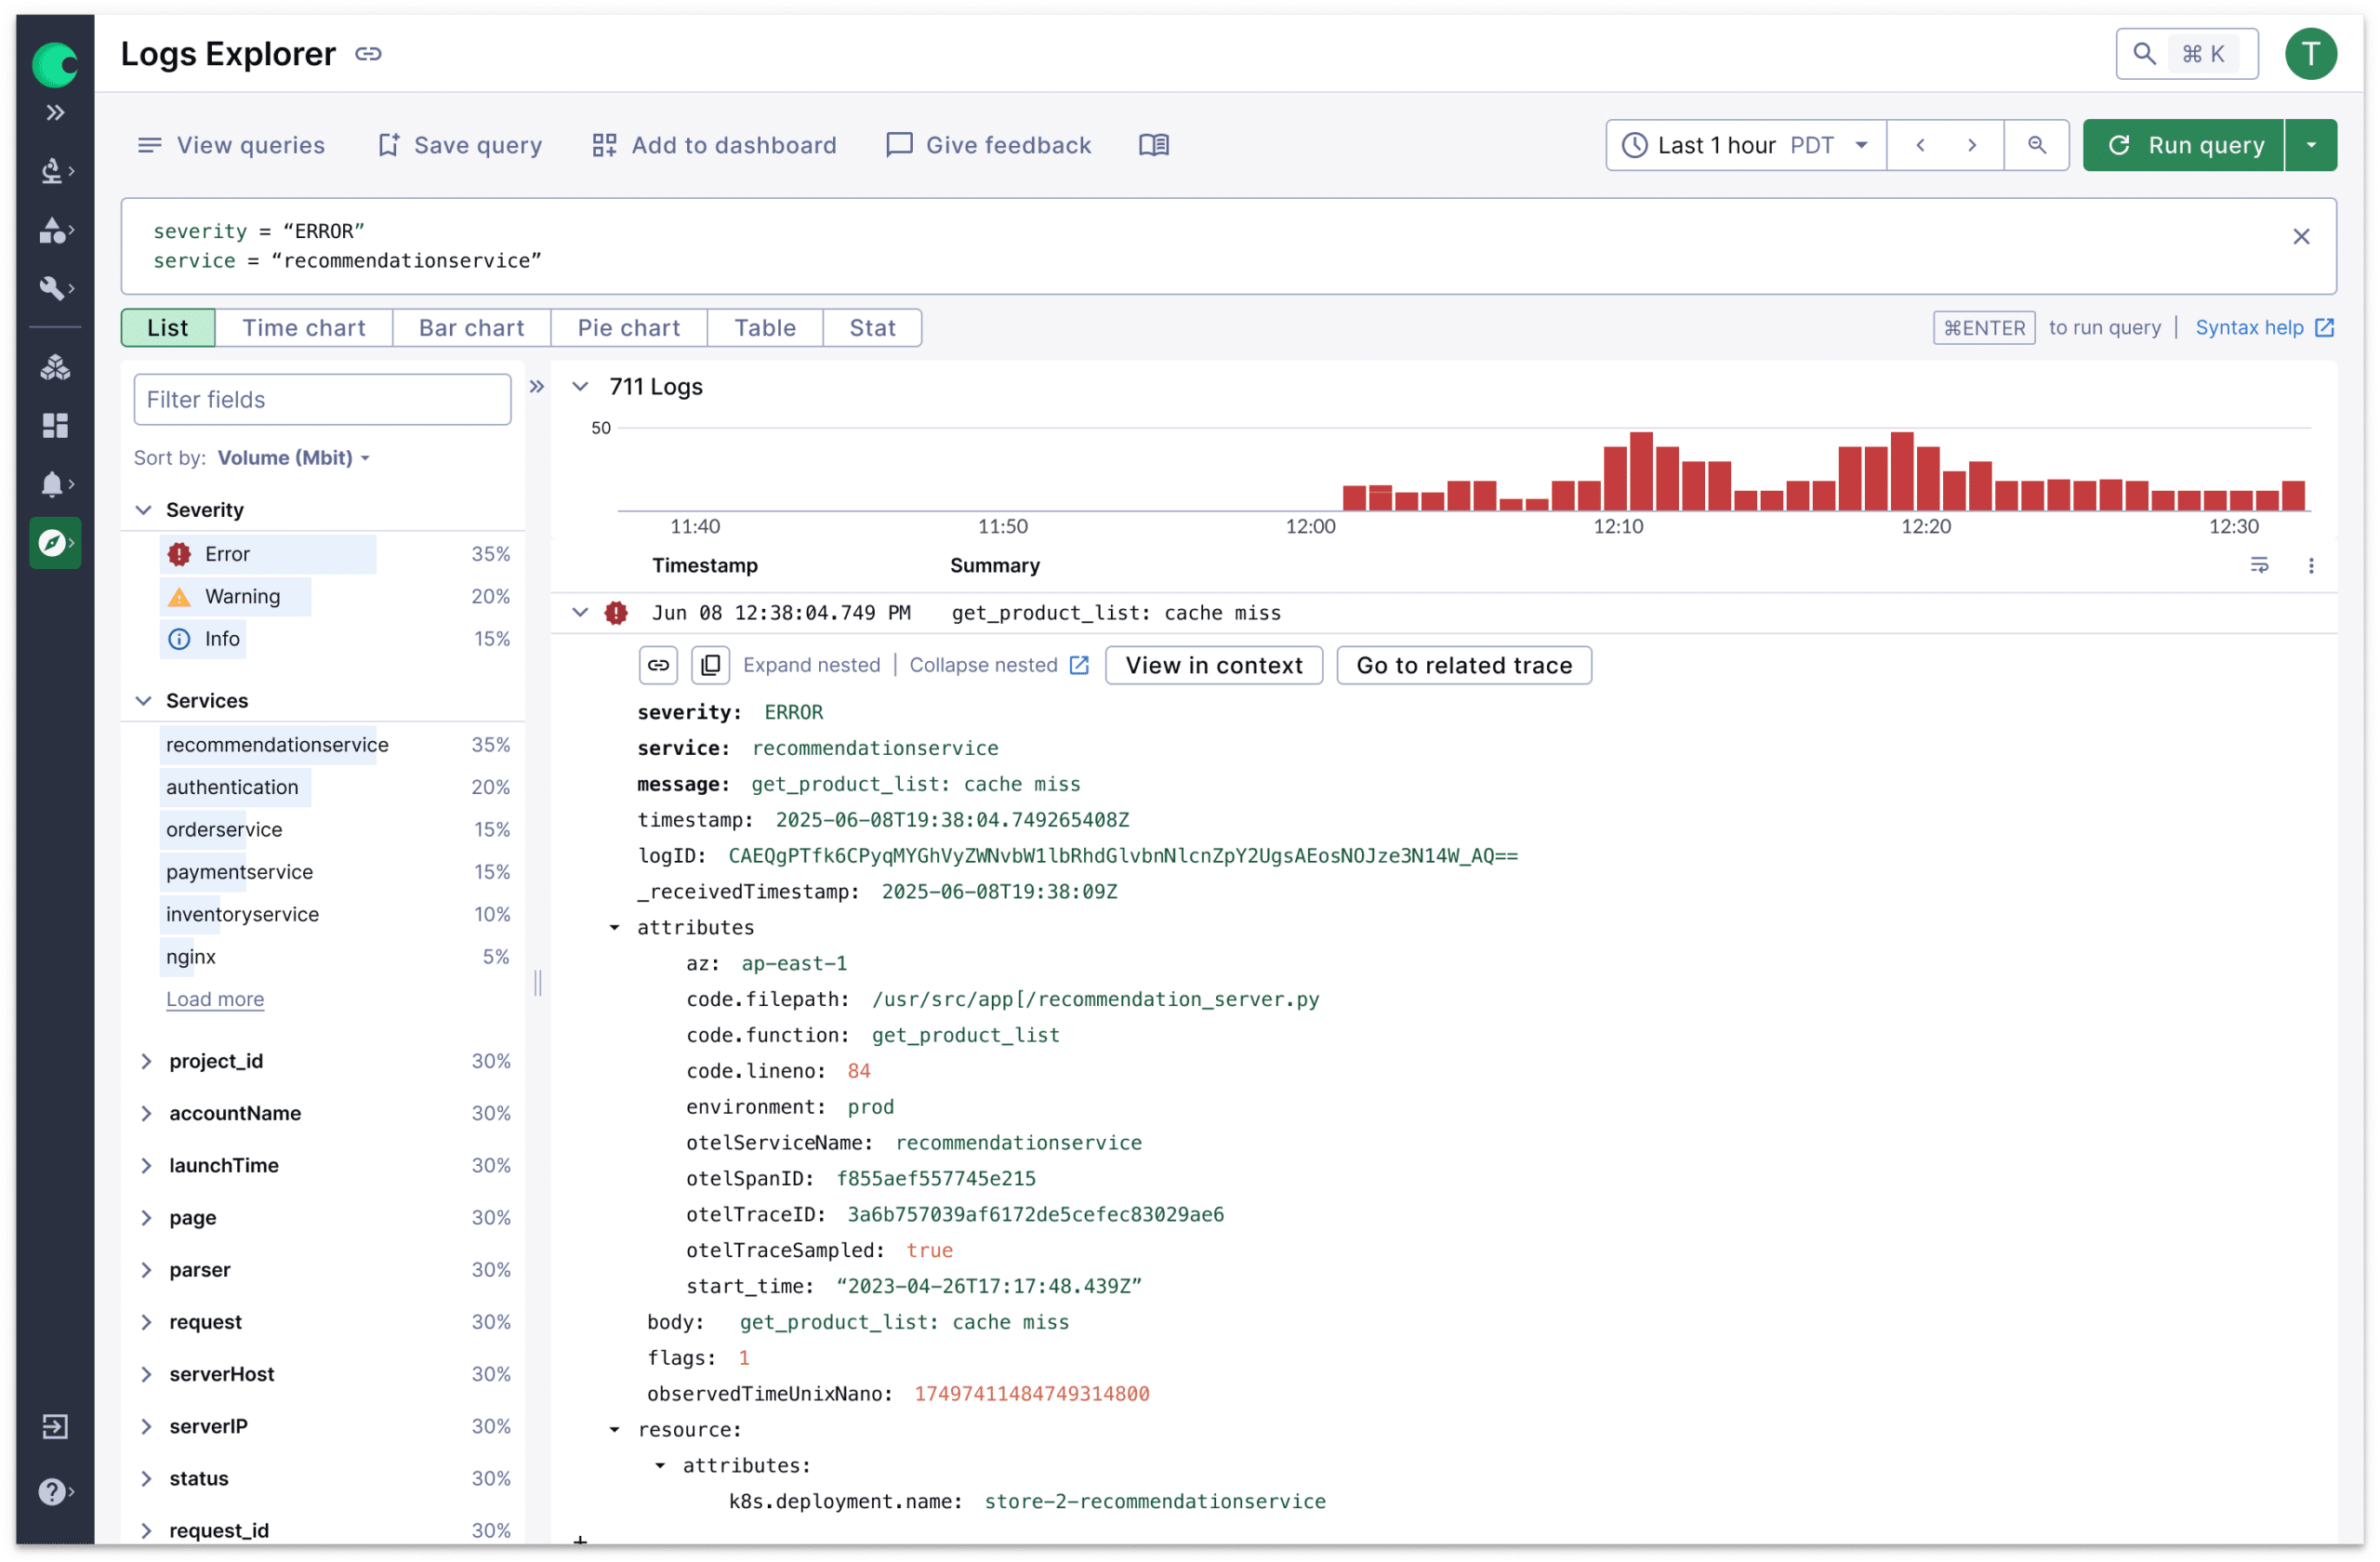
- Automatically align logs with metrics, events, and traces for each specific service
Scale Effortlessly Without Performance Trade-offs
- Search across any time range without performance impact
- Run complex aggregation queries at full speed – without the slowdowns of traditional platforms
- Handle sudden surges in log volume without performance degradation or dashboard and query slowdowns
Log Management Resources
Chronosphere Log FAQs
How is Chronosphere Logs priced?
Chronosphere Logs uses a unique two-component pricing model designed to give you maximum control over costs. Unlike traditional vendors who charge the moment logs hit your system, we separate Processing (what you ingest) from Persistence (what you choose to store).
This approach lets you ingest everything broadly, then make decisions about what's worth retaining.
Our built-in cost management tools – including Quotas and Utility Scores – provide real-time visibility into what's driving your spend. Teams can set budgets and stay accountable to their data usage goals.
What is the query language for Chronosphere Logs?
Chronosphere Logs uses a query language based on the open Kusto Query Language. This language helps your team get started without needing to learn yet proprietary syntax.
Our transparent visual query builder makes the language even more accessible by showing exactly how searches are constructed. New team members can start running effective queries on day one and advance to power-user capabilities by day two – dramatically reducing onboarding time and knowledge transfer.
The language strikes the perfect balance between simplicity for everyday searches and sophisticated power for complex investigations. Whether your team needs basic log filtering or advanced aggregations, the same intuitive syntax scales with your requirements.
How does Chronosphere Logs work with Fluent Bit and Chronosphere Telemetry Pipeline?
Chronosphere offers three complementary logging solutions that work seamlessly together, giving you flexibility to choose the right tool for each use case.
Fluent Bit serves as your lightweight log collection agent. It's the industry standard for Kubernetes environments with over 15 billion downloads. We recommend it as the preferred agent for feeding data into Chronosphere Logs.
Chronosphere Telemetry Pipeline is your vendor-agnostic data processing engine, built on Fluent Bit but designed for enterprise-scale pipeline management. Use it when you need sophisticated multi-destination routing, real-time data transformation, or pre-egress cost optimization.
Chronosphere Logs is your analysis and observability logging platform, where processed data becomes actionable insights.
These solutions all offer built-in volume control, but each excels in different scenarios. Fluent Bit handles collection, Telemetry Pipeline manages complex routing and processing at scale, and Chronosphere Logs delivers powerful analysis capabilities.


