

Cloud native technology revolutionized how our services are deployed leading to more distributed services and workflows. At the same time, adoption is rapidly accelerating, with Gartner predicting cloud native platforms will drive more than 95% of new digital initiatives by 2025.
However, complexity comes with the cloud native territory. It is harder for users to understand workflows in cloud native environments and to narrow down where problems exist. The market responded to this challenge early on by building distributed tracing tools—but they were so complex only advanced users regularly could get value from them. Novice users resorted to other ways of finding and diagnosing problems with their cloud native apps and they don’t work very well—it has become normal for on-call engineers to get a 3 AM wakeup call to help troubleshoot elusive problems.
Without easy-to-use distributed tracing tools it takes longer to remediate problems and on-call engineers struggle with terrible work-life balance.
At Chronosphere, we’ve been working to change that! Earlier this year, we added the ability to ingest trace data to our observability platform but we didn’t stop there. Today I’m happy to announce new distributed tracing capabilities allowing any user—regardless of expertise level— to quickly pinpoint a problem and go back to bed ASAP after that 3 AM page.
More direct ways to get the trace info you need
With today’s announcement, there are now three ways Chronosphere makes it easier to use distributed tracing tools and makes it easier to find where problems lie. This translates to faster remediation and better life balance for on-call engineers.
- Trace metrics
- More insightful details on a trace (without added complexity)
- Lower TCO (total cost of ownership)
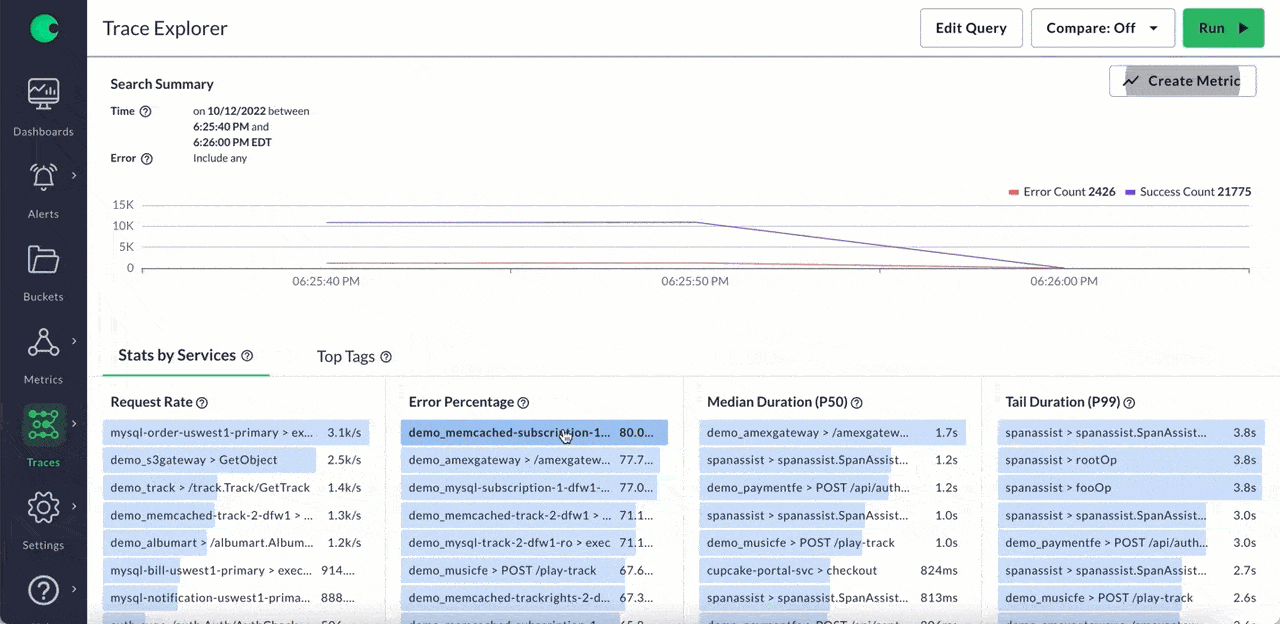
Trace metrics
A trace metric enables you to generate a new metric data point based on an entire trace or part of a trace. The metric can then be used to create an alert and/or a dashboard. The ability to jump from a trace metric alert or dashboard into the associated trace data gives users a powerful tool in the triage process to find a new error or latency.
With Chronosphere, engineers can now define metrics based on traces returned from a query. This means engineers can create a metric that feeds into a dashboard based on traces. No longer will engineers have to manually correlate individual points of metric data—they can have comprehensive metrics data they can customize to include multiple traces, all combined into a single query.
More insightful tracing details without the complexity
With deep insights, engineers are able to more quickly identify problems. Chronosphere understands that having the right insights can save engineers from headaches or spinning their wheels, so we added several new capabilities, including:
- Critical Path – Know if a given span is contributing to the full trace latency. This is helpful because not all spans in a trace are created equal. Spans that contribute to the total duration of a trace (hint: not all of them do) are considered to be part of the critical path.
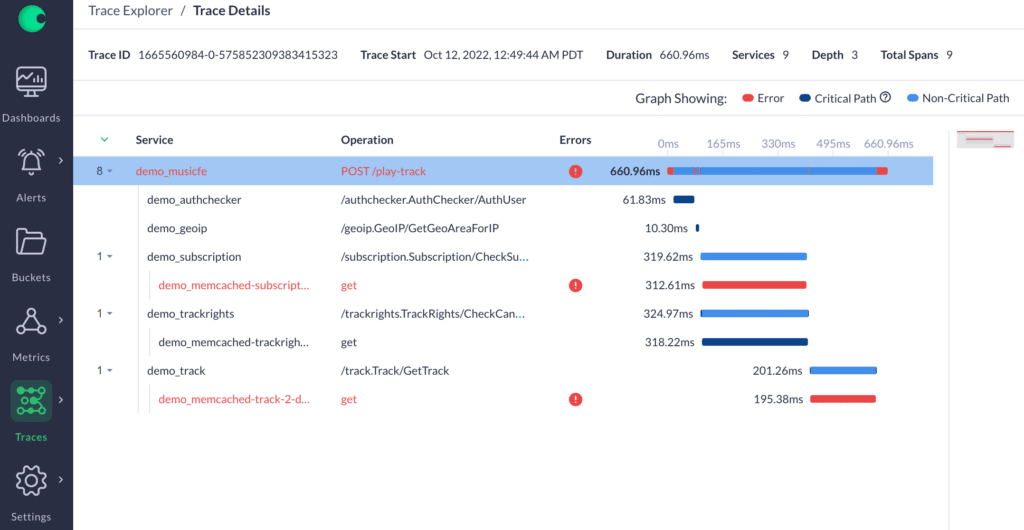
- Trace Span Logs – Easily see a log of events (e.g. X, Y, Z) to more easily infer what happened during the execution of a span. This is now a part of the trace details view.
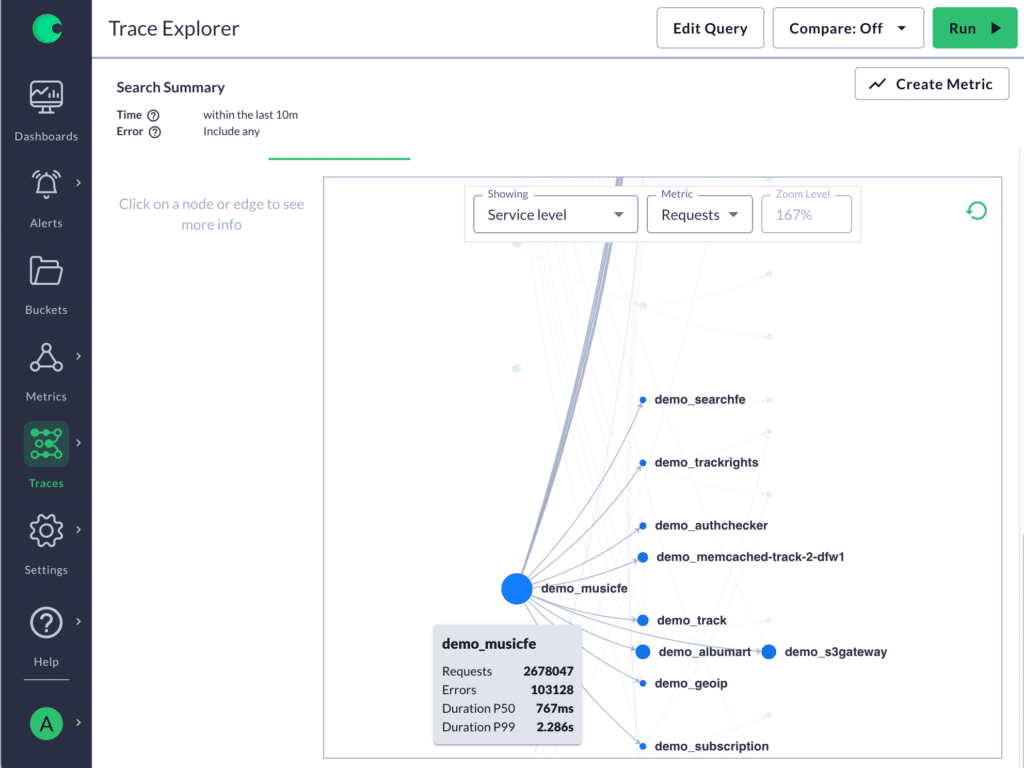
- Topology View – More easily investigate issues by providing a graphical view of how request volume, errors, and latency are propagated from service to service for a given request flow. This helps indicate where the source of an issue exists. Additionally, Topology View shows how services are related and how data flows through them for a given request.
- Trace Details View – Drill-down capabilities enabling users to quickly get more insights. For example, users can:
- Furl and unfurl nested spans
- See trace stats in header
- Find important spans in a trace when there are thousands of spans
Lower total cost of ownership
Ingesting distributed trace data at scale can cause unexpected egress costs from a cloud provider or other services. At Chronosphere, we can compress trace data, which can result in significant reductions in egress cost and lower total cost of ownership.
See it in action
Excited to see these new functions in action? Sign up for a demo now.


