What begins with metrics (Part I) and harnessing large-scale data (Part II), according to the authors of new O’Reilly Report on Cloud Native Monitoring, culminates in this final article (Part III) in the series exploring how data in cloud native architectures is constantly growing—not only in scale and cardinality but also in interdependencies. And ultimately, how metrics are the key to good observability—focused on outcomes—in a cloud native system.
The connection between cardinality and cloud native
“Containers are inherently ephemeral,” Lydia Parziale and Zach Burns write in Getting Started with z/OS Container Extensions and Docker.
“They are routinely destroyed and rebuilt from a previously pushed application image. Keep in mind that after a container is removed, all container data is gone. With containers, it is necessary that you take specific actions to deal with the ephemeral behavior.”
The other effect of using containers and cloud native architecture is that distributed systems are more flexible and more ephemeral than monolithic systems, write O’Reilly Cloud-Native Monitoring Report authors. This is because containers are faster to spin up and close down. Containers make observing an ephemeral system difficult, the authors believe, since they come and go quickly: a container that spun up just a second ago could be terminated before teams get a chance to observe it.
The authors consider a container that processes datafiles, citing this example. The container runs Python code in a database called Bronze that deletes data that’s more than one day old. It also creates a metric called job_data_processed with two dimensions, pod and database, to count the amount of data it deletes.
The metric emitted by a single pod looks like this:

This metric shows that this single pod processed 1,000 datafiles.
Dividing the thousand-file workload across 100 pods and use the same metrics, the amount of metric data produced will be multiplied by 100:
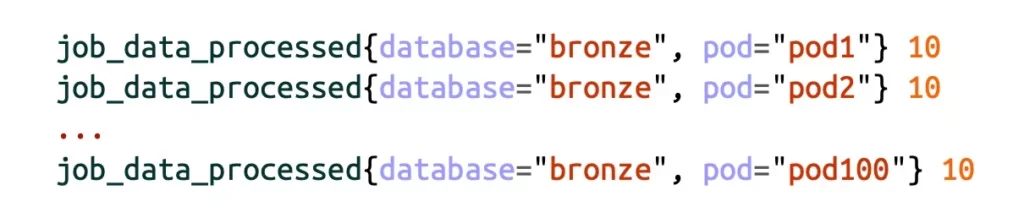
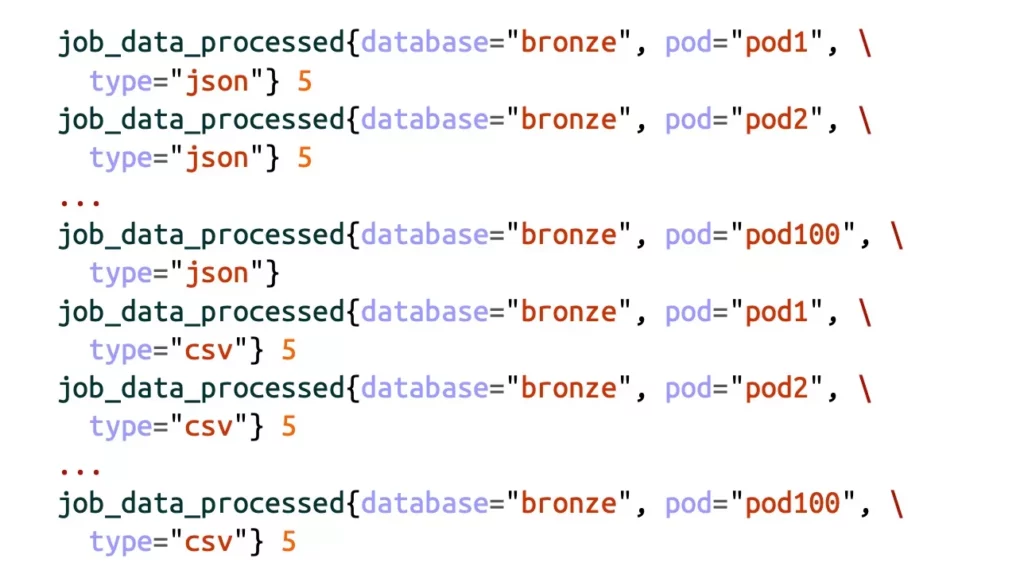
Now adding more dimensions to the metric data. Some of the datafiles are in json format, others in csv. This adds 100 additional metric data points—getting a further 100 more for each dimension added:
This is why data in cloud native architectures is constantly growing in scale and cardinality, the authors say.
The flexibility of cloud native architectures allows for increased scalability and performance. Teams can easily take a pod away or increase it a hundredfold. They can even add labels to increase the context of the metrics. This has fundamentally increased the metric data produced, the authors assert.
Cloud native services and systems have greater interdependencies
The DevOps culture in the cloud native world has given developers greater control over the entire lifecycle of their applications, including interdependencies with other applications, the O’Reilly Report authors say.
Before cloud native, developers built entire suites of different business needs in the same application. This often made it nearly impossible to scale those applications independently.
Today, however, using microservices architecture, organizations can build a new microservice for each business need and orchestrate them all to work together, the authors write. This allows for greater flexibility: scale some highly utilized parts of the architecture faster and in greater quantities than other parts. Even reuse some of the more generic services in other architectures. This is a powerful feature of microservices that offers not only greater flexibility but greater scalability as well.
However, in the architecture space, everything is a trade-off, the authors note. In this case, the team increases scalability, but the trade-off is that monitoring the individual services is more difficult. Even so, metrics let teams track individual data points to be allocated to multiple services using dimensions.
Taking the container request they cited earlier, but smartly cutting it using dimensions, illustrates their point.
Here is the original metric:

The team can now determine how many requests came from the back-end service and how many from the front-end service.
The risk of losing focus on outcomes
Metric data can grow very quickly, so even just instrumenting metrics creates a high cognitive load for any site reliability engineering (SRE) team. Because of this, paradoxically, it’s not uncommon for SRE teams to lose sight of why they’re instrumenting metrics in the first place, say the authors.
They caution that SRE teams’ performance is often graded on how “well instrumented” systems are, which then leads to increasing the number of data points they instrument. Further, this constricts their focus on the data being collected rather than on the outcomes. They might instrument too much without knowing what to do with all that data.
This approach tends to involve asking questions like:
- Do you instrument your code?
- Which data do you collect?
- How many ways can you slice and dice your data?
- Are there dashboards to visualize this data?
Worse yet, the authors say, they may even instrument the wrong data and present it to the dashboard and the alerting system.
The O’Reilly Report authors assert teams don’t have to instrument literally everything, just the metrics that matter in the organization and that allow teams to focus on outcomes.
When organizations improve the questions, the distinction (i.e. loss of focus) is even more apparent:
• Do you get alerted appropriately when there is an issue?
• Does the alert give you a good place to start your investigation?
- Are the alerts too noisy?
- How do you visualize the data you collect?
- Do you even use it at all during incidents?
- Can you use the dimensions of the metrics to help triage and scope the impact of the issue?
- Are the alerts useful and helpful before and after incidents?
The authors recommend always focusing on outcomes, which is best achieved by following the three phases of observability. Metrics are an efficient and powerful tool for all three phases of observability. They allow teams to refine processes and tools iteratively and be vigilant in measuring MTTR and MTTD even as data scales and grows.
To learn more about metrics and observability, download the Cloud Native Monitoring report.