
The goal of observability is clear. It’s to provide the fastest path to issue remediation. Yet because observability conversations can delve into an instrumentation discussion, it’s critical to understand the roles logs, metrics, and distributed tracing play in achieving the goal of rapid remediation. With this in mind, the recent O’Reilly Report on Cloud Native Monitoring delves into the topic of “metrics as a starting point”. This article is an overview, including excerpts and paraphrasing, of the authors’ views on why organizations need to start with metrics.
What is a metric?
Distributed Systems Observability co-author, Cindy Sridharan, defines a metric as “a numeric representation of data measured over intervals of time.” She notes, “Metrics can harness the power of mathematical modeling and prediction to derive knowledge of the behavior of a system over intervals of time in the present and future.”
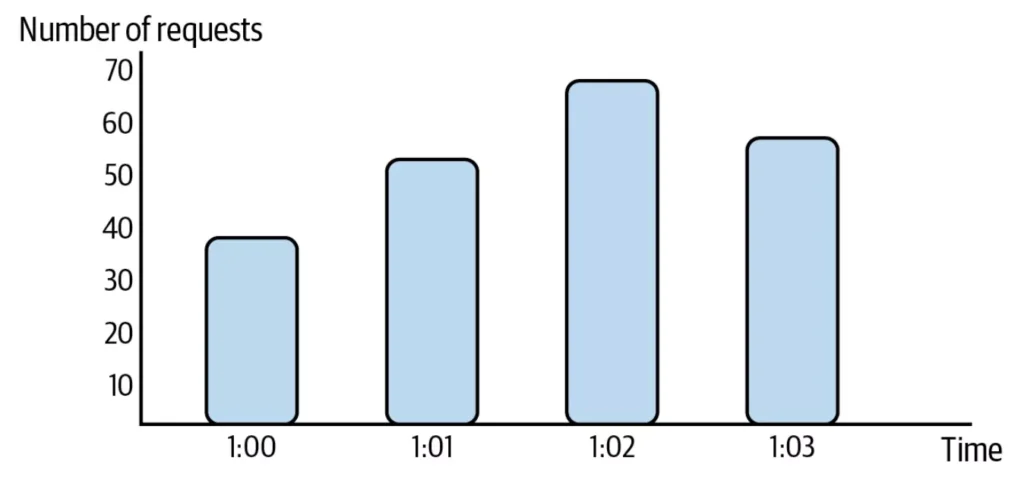
Here’s an example of measuring HTTP requests as a metric:
The case for metrics
If solving a problem requires a deep dive, the authors believe organizations might need all three signals. Here’s what each does best:
-
- Logs tell what happened in a specific period of time.
- Traces track a request from beginning to end.
- Metrics provide a bird’s-eye view.
Starting with metrics is logical, the O’Reilly authors say, because it lets teams move from the broadest view down to the narrowest.
Four ways metrics move organizations to remediate faster
Easy to use and implement, metrics provide low-latency impact analysis for data comparison over time. Here’s how metrics advance resolutions in real-world scenarios.
1. Metrics provide an efficient snapshot of the system
First, metrics allow teams to understand the current state of the system efficiently. With some contextual knowledge, people can ask questions and prove or disprove assumptions and start troubleshooting right away.
The authors provide this example: “Is there an HTTP:503 Service Unavailable error? When did it happen?” Combined with context, metrics deliver those answers quickly—without a JSON filter or a full-text search for all HTTP response codes.
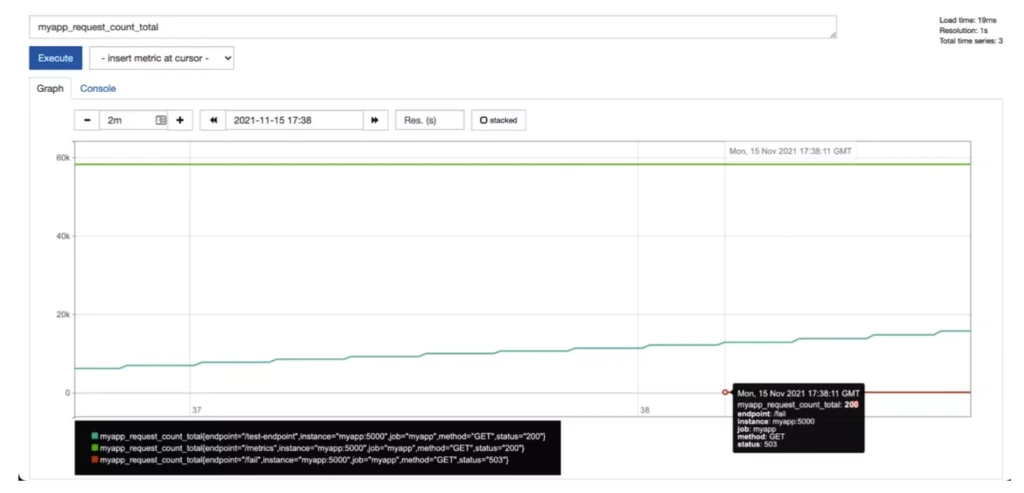
Prometheus, which collects metrics by scraping metrics HTTP end‐ points on monitored targets, is one of the most popular metrics and monitoring platforms, the authors say. If an organization has an HTTP server that’s producing an HTTP:503 Service Unavailable error, it’s easy to detect that quickly by graphing a metric in Prometheus.
The metrics (even without logs) show the HTTP:503 Service Unavailable errors started at 17:38 GMT. But it’s hard to see if there is a new HTTP:503 Service Unavailable. If people want to alert on it, usually they will need to aggregate counters rate() or irate().
First, metrics allow teams to understand the current state of the system efficiently. With some contextual knowledge, people can ask questions and prove or disprove assumptions and start troubleshooting right away.
The authors provide this example: “Is there an HTTP:503 Service Unavailable error? When did it happen?” Combined with context, metrics deliver those answers quickly—without a JSON filter or a full-text search for all HTTP response codes.
Prometheus, which collects metrics by scraping metrics HTTP end‐ points on monitored targets, is one of the most popular metrics and monitoring platforms, the authors say. If an organization has an HTTP server that’s producing an HTTP:503 Service Unavailable error, it’s easy to detect that quickly by graphing a metric in Prometheus.
The metrics (even without logs) show the HTTP:503 Service Unavailable errors started at 17:38 GMT. But it’s hard to see if there is a new HTTP:503 Service Unavailable. If people want to alert on it, usually they will need to aggregate counters rate() or irate().
2. Metrics are easy to use and implement
Metrics provide the most utility with the least amount of set up effort, the authors agree. The open source tools teams are already using are likely to support Prometheus exposition formats.
In NGINX, PostgreSQL, and Kubernetes, for example, user communities have built Prometheus exporters that teams can run using just a few lines of configuration.
3. Metrics let teams aggregate data quickly and compare it
Metrics allow people to observe aggregated data over time, which is the fastest way to combine data to troubleshoot and fix a system, write the report’s authors.
For example, teams can find out how many bounces have happened in the last hour or the last day. They can see where the most bounces occur and even at which endpoints they happen. Moreover, depending on the type of metrics, there are multiple ways to aggregate.
These are examples they provide of aggregated metric requests using Prometheus Query Language (PromQL) used in and using the types of metrics the authors defined.

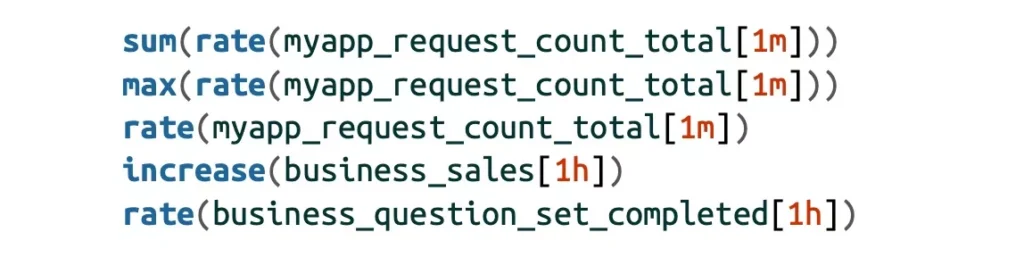

In many cases, teams still want to retain or remove the cardinality of these metrics while aggregating (more on cardinality in Part II of this series). To do so, they will need to use by to aggregate based on a dimension or without to aggregate all dimensions except for the one specified.
For example:

Sum adds all the requests and aggregates the metric. Max takes the highest value of the metric and ignores the other value. Count gives the metric’s cardinality. These aggregations are useful when setting up advanced detection.
3. Metrics let teams quickly aggregate and compare data
Metrics are a numerical summary or aggregation of data, and because of that, they are far more efficient to query than detailed logging or tracing data, the authors write.
Storing the number of requests as a metric, for example, is far more efficient than counting the individual log messages for every request. Even if there is no metrics instrumentation, it’s often more efficient and recommended to create metrics from logs and traces for notification and triage purposes.
Want to see only the requests that produced errors? Teams can query their metrics to filter out the successful requests. This example counts only the maximum number of requests that are successful:

4. Metrics allow us to create alerts
The authors also explain how metrics allow teams to create alerts. In Site Reliability Engineering, Rob Ewaschuk defines alerts as “notifications intended to be read by a human and…pushed to a system such as a bug or a ticket queue, an email alias, or a pager.”[2]
As the name suggests, alerts let teams know when there’s a problem. They’re meant to tell when the system reaches a certain threshold that’s been set, such as a number of HTTP requests, a certain error being generated, or even a smoke alarm sensor picking up a certain level of smoke in the air. Querying metrics is a very efficient way to generate the alerts teams need before they even go to individual logs, say the authors.
Using the same Prometheus request, for example, allows a team to alert on any occurrence of HTTP:503 Service Unavailable simply by using the same query and adding an evaluation greater than 0:

This efficiency, the O’Reilly Report authors assert, makes metrics unquestionably the best observability input.
When the observability business goal is rapid issue remediation, teams should prioritize metrics (before logs and distributed tracing) for best results.
This blog is part of a series on “why metrics”. In the next installment, we cover “How to harness metrics to achieve business goals.”
About the authors
Kenichi Shibata is a cloud native architect at esure, specializing in cloud migration and cloud native microservices implementation using infrastructure as code, container orchestration, and host configuration management, and CI/CD. He has production experience in Kubernetes in a highly scalable and highly regulated environment.
Rob Skillington is the cofounder and CTO of Chronosphere. He was previously at Uber, where he was the technical lead of the observability team and creator of M3DB, the time-series database at the core of M3.
Martin Mao is the cofounder and CEO of Chronosphere. He was previously at Uber, where he led the development and SRE teams that created and operated M3.


