
In a review of observability’s inputs (Part I: Why metrics are the right starting point in observability), the O’Reilly Report authors describe the need for and types of metrics most beneficial to achieving observability’s goal of rapid remediation. In this article (Part II), excerpted and paraphrased from the same report, they highlight the need for organizations to successfully deal with large-scale data to achieve good observability in a cloud native system.
Data volume and cardinality explode
The massive shift of systems globally from monoliths to the cloud has resulted in an ongoing explosion of metric data in terms of both volume and cardinality, the authors write. This is especially prevalent in cloud native systems. To achieve good observability in a cloud native system, they assert teams will have to deal with large-scale data.
They describe the rapid increase of data as a metric scale, or the number of metrics produced during instrumentation. For example:
- How many things are you measuring?
- How much data does that measurement produce?
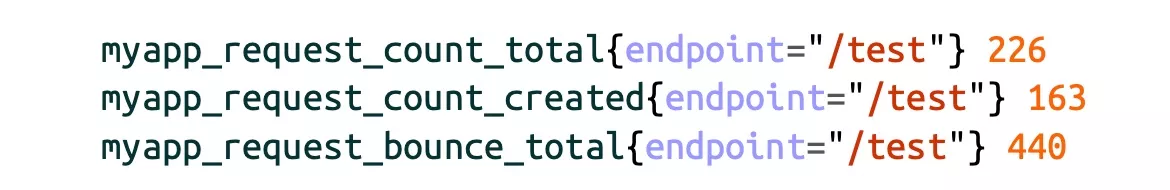
Using MyApp as a fictional app example, the authors assert, a team would start by using a metric called myapp_request_count_total, which counts the number of HTTP requests MyApp receives:

Now team members can add more metric data, like all created requests, all requests, and all bounced requests:
The authors note how fast the volume of data can increase when more metrics are added. The volume of logs and traces doesn’t change very much, as a rule they say, but metrics is a different story.
What are cardinality and dimensionality?
Each increase in cardinality multiplicatively increases the volume of metrics, which requires more system resources for Prometheus, write the O’Reilly Report authors. High cardinality, therefore, degrades Prometheus’s performance. As organizations gather more dimensions for each metric, they add observability context—at the cost of Prometheus performance.
- Cardinality is the number of possible groupings depending on the dimensions the metrics have.
- Dimensions are the different properties of the data.
Here’s the simple example they provide which asks the reader to consider the labels on a shirt sold from a store shelf.
Each label contains three dimensions:
- Color
- Size
- Type
Each dimension increases the amount of information people have about that shirt, the authors explain. Someone could slice that information into many shapes, based on how many dimensions used to sort it. For example, by just color and size, size and type, or all three.
Dimensionality is being able to slice the metrics into multiple shapes.
Increased dimensionality can greatly increase cardinality. Cardinality, in the example they use, would be the total number of possible labels that happen by combining those dimensions from the shirts in inventory.
This is the visual they share of two dimensions: color and size.
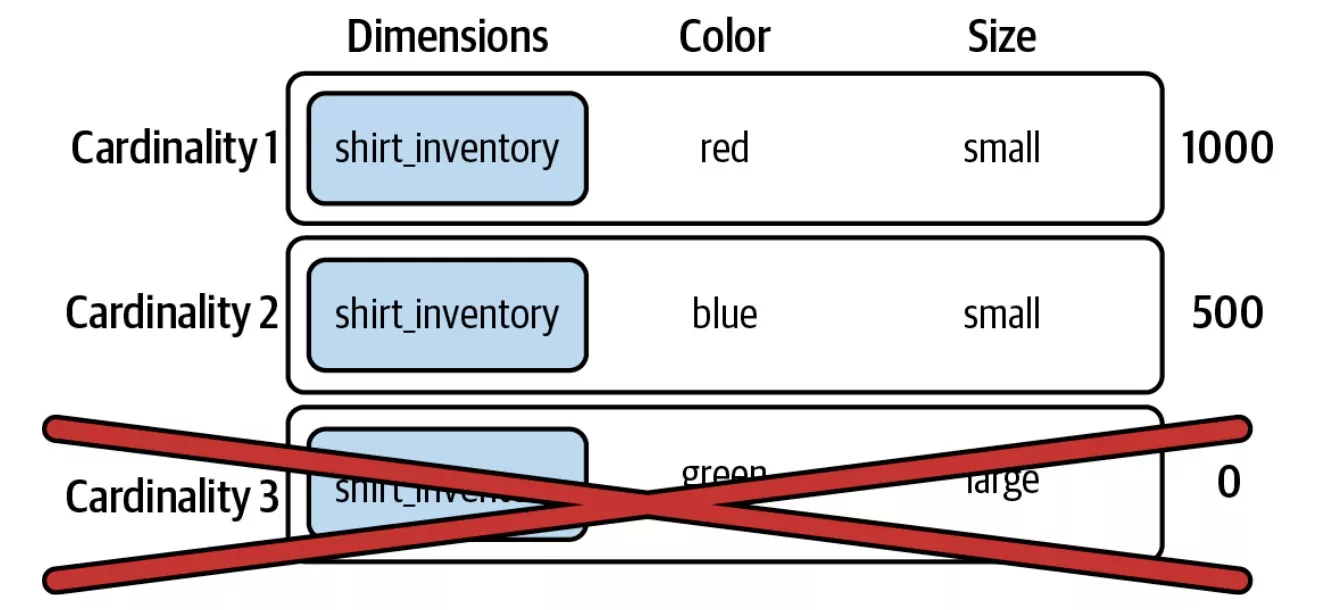
There are only two cardinalities represented in the figure, the authors write, even though there are three possibilities. That’s because the last combination, while theoretically possible, is not in the inventory and therefore is not emitted to the metrics platform.
According to the authors, the term metric cardinality refers to how many unique combinations of metric data “are produced by a combination of metric names and their associated label [dimension] names/values,” while the total number of combinations with data that exists are cardinalities.
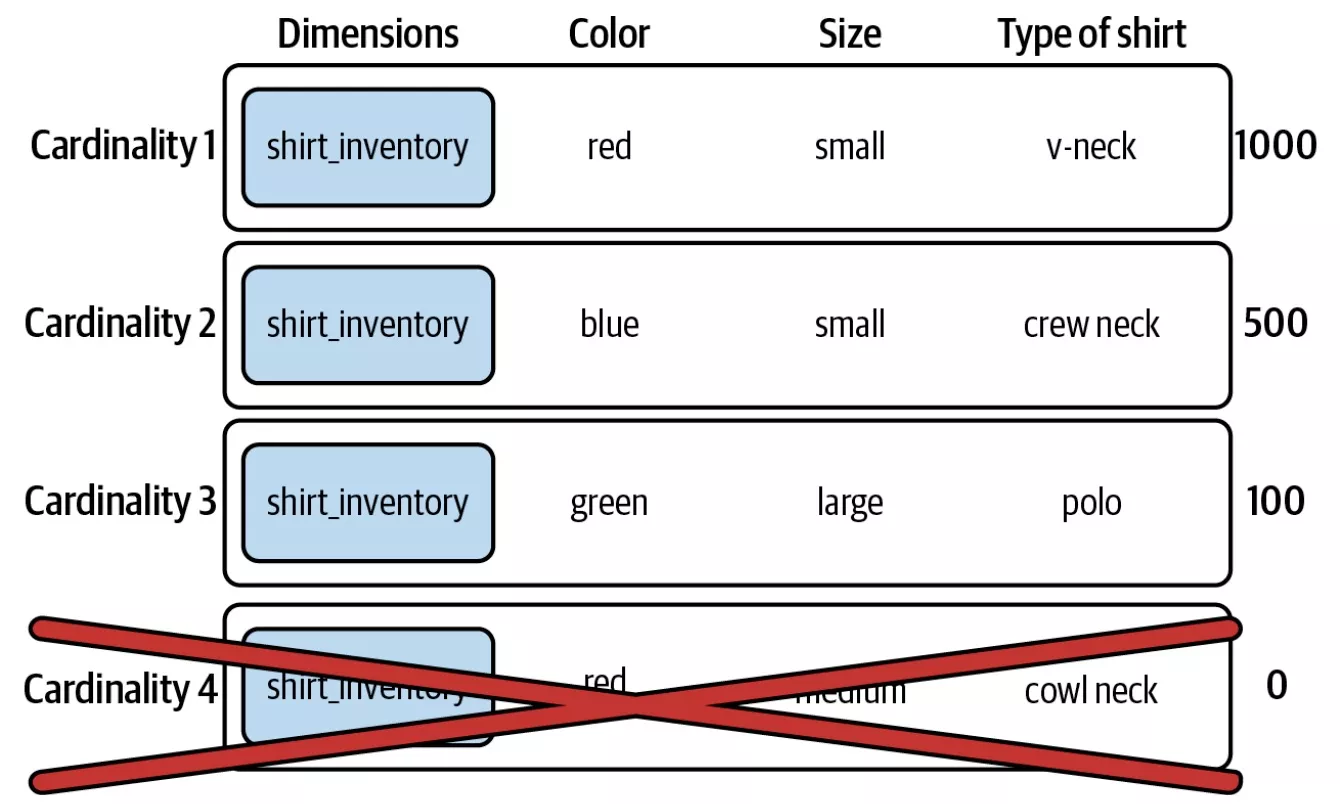
They ask, “What happens if someone increases the number of dimensions, and therefore of possible cardinalities, by adding the type of shirt? The answer is increasing the number of dimensions also increases the cardinality of the metrics.
In a software world example, the authors illustrate what would happen to count the total number of HTTP requests in an API:
Use the metric api_http_requests_total with two dimensions, method and handler. Working again in Prometheus, run:

The total number of requests, in this case, is 60.
To track the HTTP status code would add a third dimension:
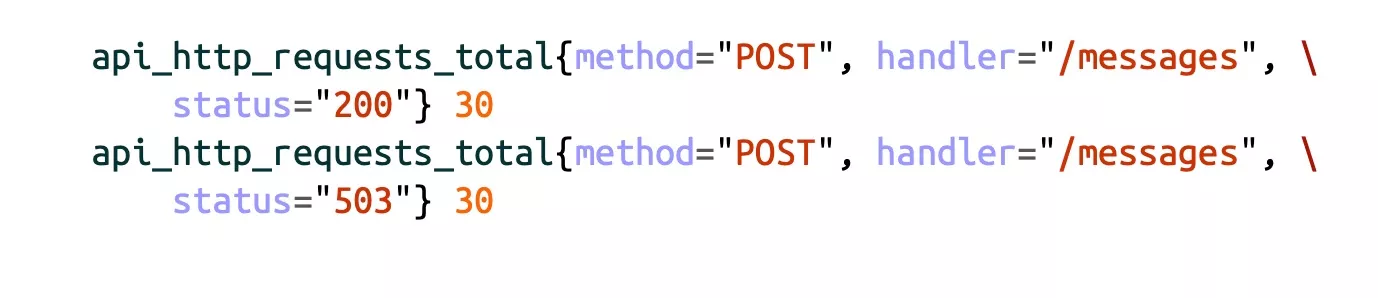
“Cardinality is multiplicative—each additional dimension will increase the number of produced time series [metric data] by repeating the existing dimensions for each value of the new one.”
With a good understanding of why metrics matter most in observability (Part I) and how to successfully deal with large-scale data (Part II), the final article in this series (Part III) describes the steps the O’Reilly Cloud Native Monitoring report authors believe are needed for organizations to achieve good observability in a cloud native system.


