


On-call duty rigors explained
Picture this: You’re having a blast after an afternoon of fun in the sun at your friend’s weekend BBQ, only to discover you’ve missed 10 calls from PagerDuty. In the middle of the celebration, you’ve forgotten that you are primary on-call. Thankfully, your company is disciplined about setting up escalation policies.
This isn’t ideal, but luckily you have a secondary on-call duty schedule in place for moments like this. When you check Slack for updates to see if you need to step in, your stomach drops. Somehow the secondary on-call missed their alerts too, causing the issue to escalate to the tertiary manager rotation and then up to the executive team, with the CTO now in charge of managing the incident… oops.
This scenario actually occurred at a previous job over the year-end holidays instead of summer break. It’s too easy to sit back and critique how the incident was handled, placing blame on both the primary and secondary for their negligence. If this is you, I think Sidney Dekker’s Stop Blaming offers a different viewpoint that might make you think twice before casting blame.
Several factors contributed to this mishap:
- The new opt-in volunteer rotation over holiday breaks was new, started just a few weeks prior to distribute the on-call responsibilities more evenly.
- Unlike the typical week-long rotations, these holiday shifts were only 12 hours, disrupting the usual routine. Engineers were accustomed to serving 1 full week as secondary and then transitioning to primary for another full week.,
- During the holidays, many engineers who would typically be online and able to catch early issues — or jump in to assist response — were instead also enjoying time with friends and family.
Incident response during the holiday season, including summer and spring break for parents, is challenging due to disruptions in routine and limited availability of engineers.
It also emphasizes how much an organization relies on a few “hero” engineers, who can get manually paged or sought out in order to aid in response or fill in critical knowledge. Relying on “heroes” can hinder the growth and development of other engineers and lead to heroes burning out. The issue isn’t that you have subject matter experts; it’s that this operational and system knowledge is concentrated in a few individuals.
As the summer season kicks off, consider how you can transform holiday on-call duties from a burden into a learning opportunity. One critical step is to increase the observability of your system — the services you are directly on-call for, the infrastructure they are running on, and your “service neighborhood” made up of up and downstream dependencies.
The paradox of observability platforms
There’s an inherent paradox in the use of observability platforms. While these platforms are essential for ingesting, processing, storing, and analyzing data such as events, metrics, traces, and logs, simply having one doesn’t automatically mean your system is highly observable.
Contrary to what some might hope, there is no magical “instant observability” powder that you can sprinkle on your system to gain deep insights out of the box. Moreover, increasing the number of observability platforms does not necessarily improve observability. This is something that personnel in the 60% of organizations that juggle 10 or more observability tools can attest to.
Observability platforms play a crucial role in systematizing institutional knowledge, making telemetry data accessible to everyone, and enabling engineers—from the newest recruits to those managing on-call duties over the holidays—to confidently address issues in the services they oversee, along with their upstream and downstream dependencies, without needing to rely on “heroes.
How to improve observability
To increase observability, follow these four steps:
1. Link telemetry types together
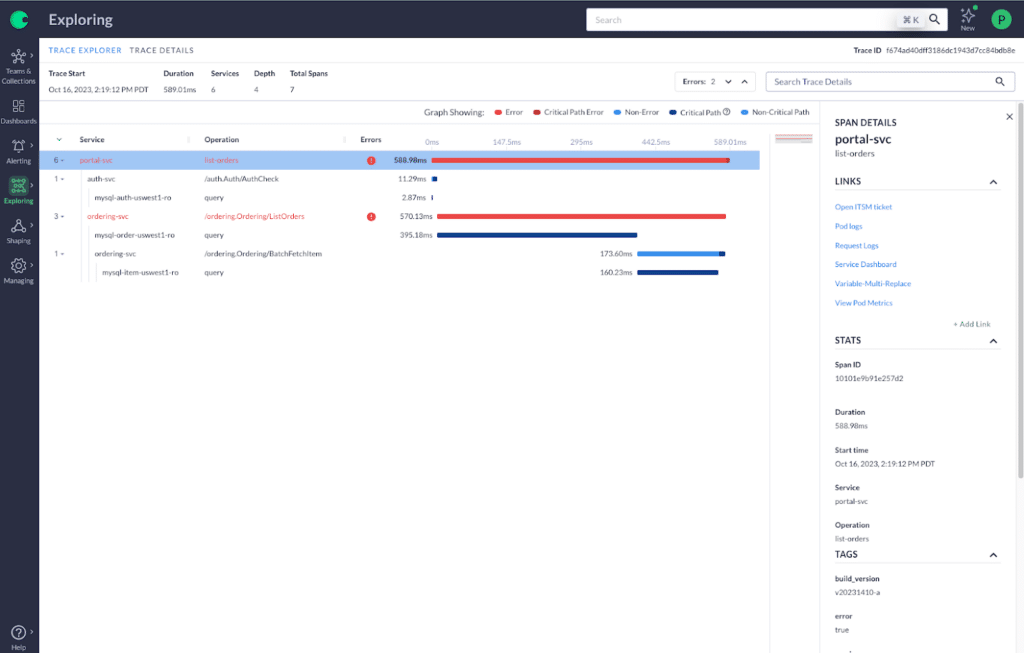
Connect telemetry within and across various tools. This allows you to seamlessly navigate from one piece of data to another—from an anomaly in a metric, to related change events, to detailed traces, and finally to the logs of a particular service. This linkage facilitates swift investigations.
Include runbooks for every paging alert. If an alert justifies paging an engineer, it needs to also have a detailed runbook, outlining the impact to customer experience and potential mitigations — this makes information just a click away and speeds up your response.
Establish links to communication channels. In environments with frequent reorganizations or team changes, quickly identifying who is responsible for what and how to contact them is crucial. Embedding links to team communication channels can streamline communication within the organization.
2. Incorporate business metrics
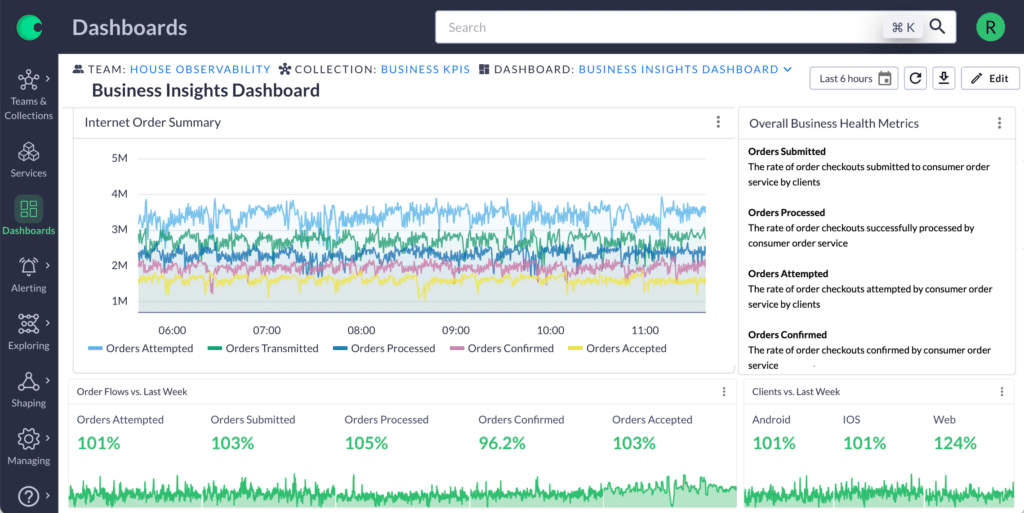
Bridge your application and infrastructure telemetry with business metrics from areas like customer success, revenue, or operations. By linking technical data to broader organizational objectives, you amplify the value of your observability data. For instance, correlating a fixed bug with a 30% reduction in support tickets or increased user login rates can demonstrate tangible business impacts.
3. Enhance event tracking
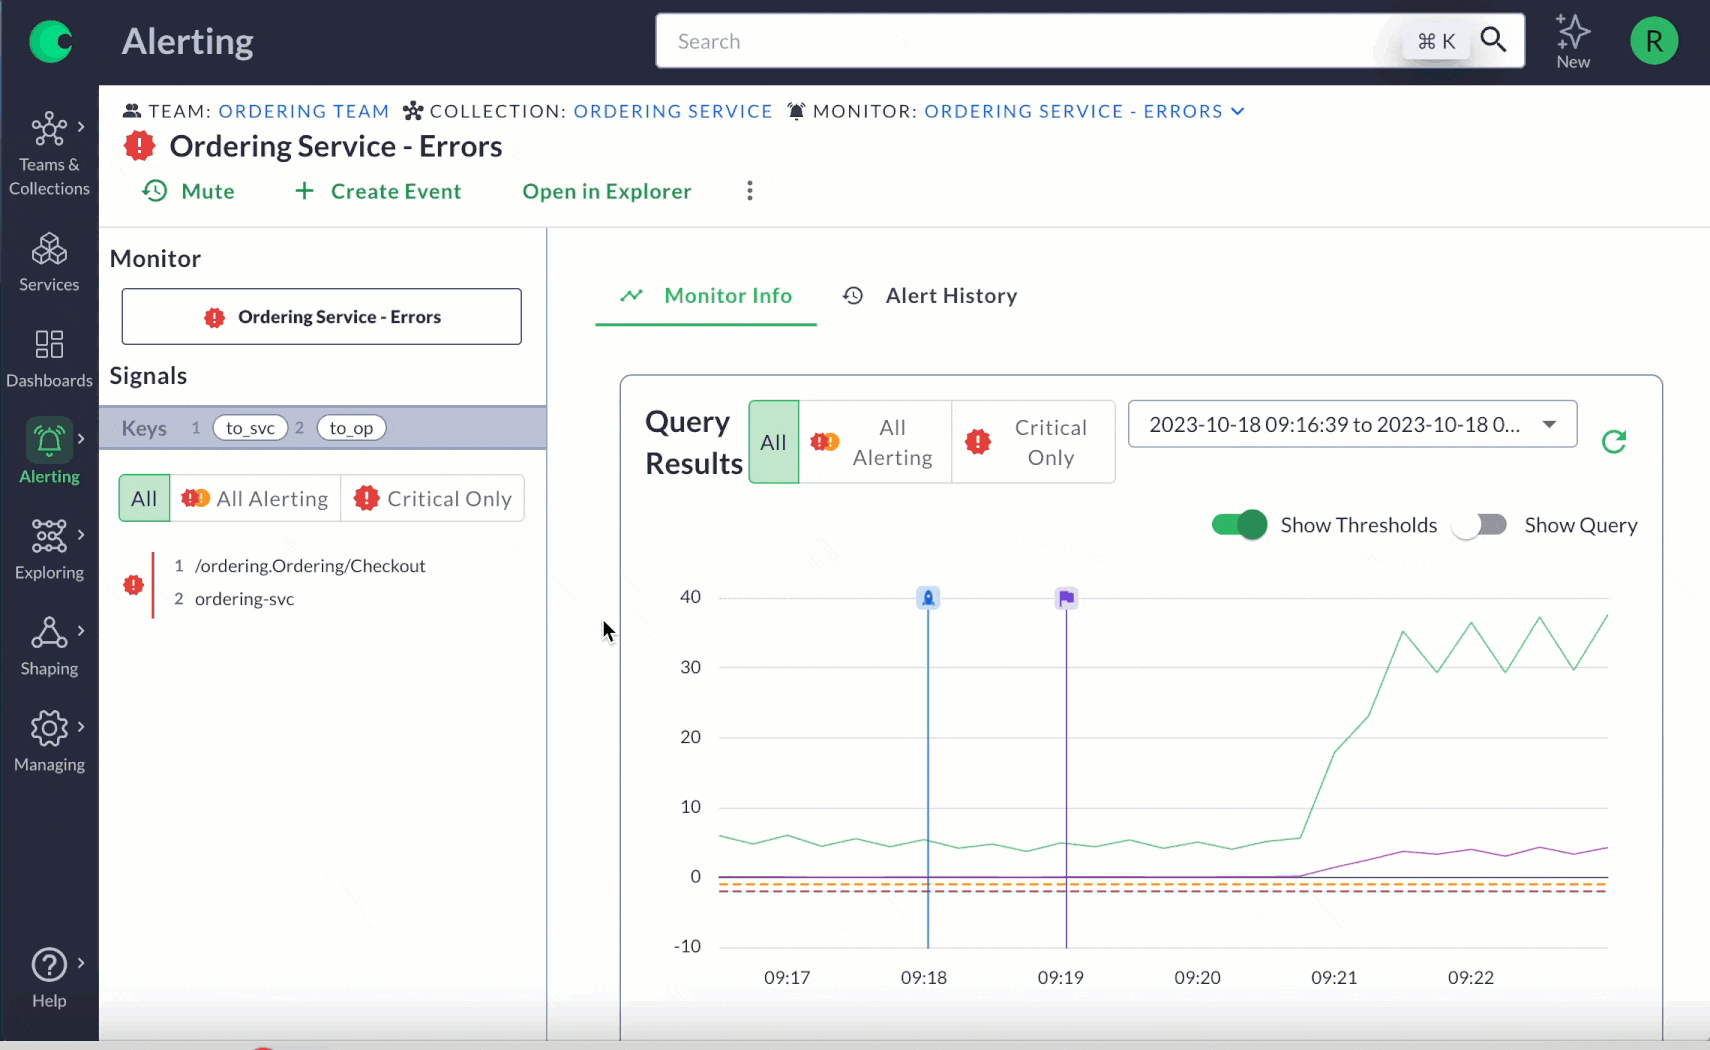
Track key events such as deployments, feature flags, infrastructure modifications, and third-party service statuses on your charts. This allows for quicker correlation of events with system changes, avoiding the need to sift through communications channels or additional tooling for updates. You can also track business-related events, like new customer onboarding or coupon distribution, to directly connect system performance with customer experience.
4. Customize dashboards for essential workflows
While default dashboards provide basic insights, creating custom dashboards tailored to your specific needs can significantly improve your understanding of complex systems. Custom dashboards are especially beneficial when dealing with complex queries or managing issues that cross multiple team or service boundaries.
Implementing these streamlines incident response but also deepens the integration of observability into the broader business context.
Advocating for increased observability
It’s relatively easy to get other engineers on board with improving observability since they also struggle with using multiple tools and trying to make sense of scattered data during investigations. The bigger challenge lies in getting the top leaders of your company to agree. Often, they only take interest after a major incident that affects key customers or a long and widespread outage that gets their attention.
Use the summer holiday season as an opportunity to push for better practices today. Start with your own team—you can even share this article with them as a conversation starter to figure out what areas that need investment. Spend your on-call shifts working to better observability for the services you operate and record the results of your efforts.
Then, share what you learn with a broader audience, your sister teams, the infrastructure/operations team and, eventually, the whole organization. This sharing helps make a strong case for why the leaders should focus on and fund these improvements.
Put observability on the top of your summer wish list
If you find your current observability tools lacking, especially when you’re on-call (during the holidays or otherwise), it might be time for an upgrade. Consider these key features:
Linked telemetry: Allows you to connect different types of telemetry data together — think about having the ability to go from a metric chart to related traces and from traces to service logs. This saves you from having to switch between applications to gather all the necessary details.
Annotations: With Chronosphere you can add annotations to your monitors, providing a direct link to your runbook no matter where it lives.
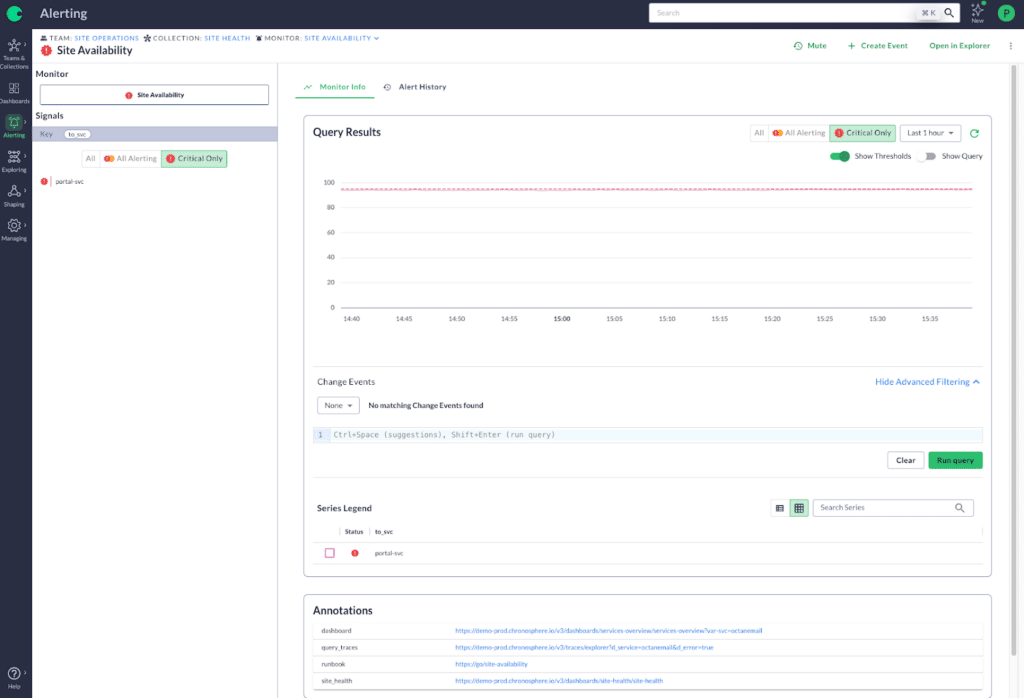
Change Event Tracking: This function stores all recent integration changes in one place, making it easier to see what’s happening with feature flags, CI/CD, infrastructure events and custom events you set up. With a centralized source, you can quickly catch anomalies in real time – regardless where they are in your system.
Dashboards: Every team has unique data needs. By customizing dashboards, you make it easier for everyone to understand what’s happening in the environment and address issues quickly.
Every engineer should have access to telemetry and tools that allow them to explore beyond the services they manage. Choosing the right observability vendor for your system and having effective, detailed telemetry are crucial for supporting you both during and outside of on-call hours. These tools help ensure your systems operate smoothly every day. However, they become especially vital during the holiday season, when you’re likely dealing with reduced staff and shifting resources.
On-Call Duty FAQ
What is on-call duty?
On-call duty is when employees, such as engineers or IT professionals, must be available during and outside regular working hours to address emergencies or critical issues with systems or services.
How frequently do developers get assigned on-call duty?
The frequency of on-call assignments varies by organization and team size but typically involves rotating shifts among team members, ranging from every few weeks to every few months.
Is there a way to make on-call duty less stressful?
Yes, enhancing observability can significantly reduce the stress of on-call duties. By improving system monitoring and alerts to be more precise and actionable, engineers can quickly identify and address issues. Effective observability tools provide clear insights and data, making it easier to diagnose and resolve problems efficiently, thereby minimizing the potential for overwhelming or unexpected crises.


