")


Introducing Chronosphere Lens
In the fast-paced world of cloud native development, complexity is a given. Microservices, containers, and DevOps have given organizations the power to scale and adapt like never before. But with this dynamism comes a set of challenges that are all too familiar: The pressure on key individuals to become “heroes,” the struggle for truly unified observability, and the constant context-switching between tools that don’t quite “get it.”
Existing application performance monitoring (APM) and infrastructure monitoring tools are failing developers, which is why we’ve reimagined cloud native observability to help them not just survive in this complex landscape, but thrive. Introducing the next chapter of Chronosphere — where we unveil pivotal enhancements that promise to fundamentally shift the way engineers perceive, navigate, and act upon your observability data. At the heart of this transformation is Chronosphere Lens, a groundbreaking capability designed to bring clarity to chaos.
To further support developers, we’re also adding comprehensive support for Events — which helps them gain insight into all the changes that are affecting their environment, such as deployments or feature flag changes, and lays the foundation for a number of other problems that this will allow us to tackle in the future.
In this blog, we’ll delve into why these features are game-changers, how they fit into the bigger picture of cloud native development, and how they not only support your business objectives but are a powerful catalyst for innovation and growth.
The evolution of cloud native observability
As cloud native architectures have proliferated alongside DevOps, they’ve brought unparalleled agility and scalability to the enterprise. However, they’ve also introduced a mazelike complexity that traditional tools and methods can’t adequately navigate. This has prompted an evolution in the observability space—one that is still in progress but vitally necessary.
The ‘hero developer’ dilemma
In this complex landscape, the onus often falls on a select few — sometimes known as “hero developers” — to manage and make sense of a web of metrics, traces, and events. These individuals possess the technical acumen to dive deep into issues, but they are also, unfortunately, becoming bottlenecks in the system. Organizations find themselves overly reliant on these key individuals, creating single points of failure and an environment ripe for burnout. It’s a model that’s unsustainable in the long term and detrimental to both operational efficiency and team well-being.
Fragmented visibility
Another challenge that has surfaced with cloud native expansion is the fragmentation of tools and data. Even the best developers can find themselves lost in a sea of disparate dashboards – both within individual tools and across multiple platforms – each offering a slice of the information needed to troubleshoot issues or understand system performance.
This disjointed experience leads to increased reaction times, error-prone diagnoses, and a general sense of frustration. Moreover, the very structure of cloud native ecosystems, laden with Kubernetes orchestration and ephemeral resources, exacerbates this challenge. The lack of a centralized, context-rich observability platform turns every incident into a drawn-out fire drill.
Tools misaligned with the developer mental model
Then there’s the matter of tooling that doesn’t align with the “you build it, you run it” ethos of modern development practices. Not only were many existing platforms designed with a different era in mind, but they also don’t match the developer’s mental model, especially as we transition from monolithic architectures to microservices. This mismatch creates a cognitive dissonance that imposes a hidden tax on every development cycle. Developers are forced to adapt to a mindset and a workflow that are out of sync with today’s DevOps cultures. This not only results in wasted time but also unnecessarily elevates cognitive load — resources far better spent on innovation and problem-solving.
This evolution calls for a different kind of observability solution, one that doesn’t merely update old paradigms but instead rethinks them for the cloud native age. In our next sections, we’ll introduce you to the new releases of Chronosphere that do just that.
Chronosphere Lens: Empowering developer effectiveness in the cloud native age
As we’ve navigated the evolution of cloud native landscapes and the challenges that come with them, it became evident that a radical shift in observability was not just an opportunity — it was a necessity. Enter Chronosphere Lens, our approach to tackling the complexities of modern applications head-on.
Developer-driven observability
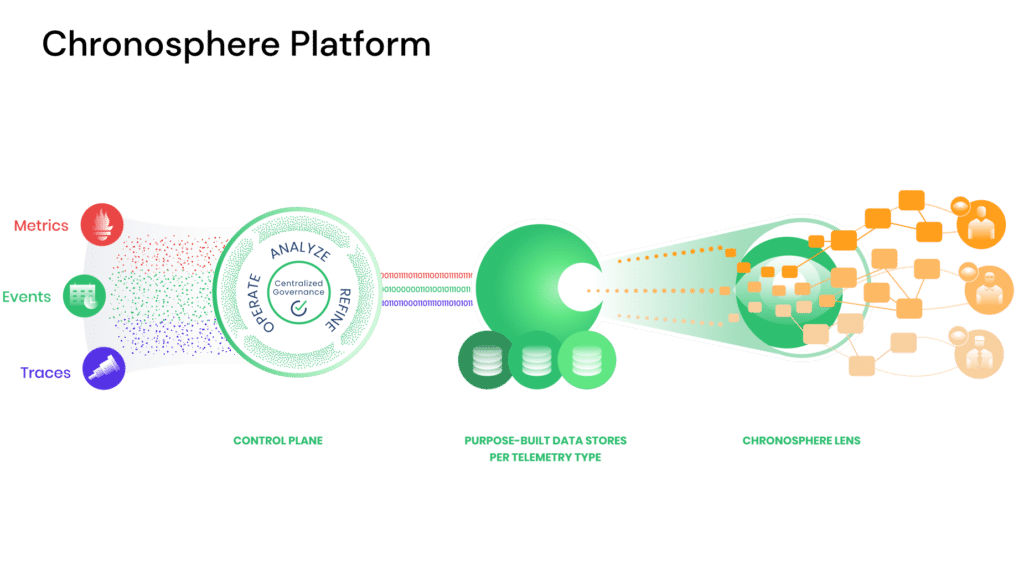
Traditional APM and infrastructure monitoring tools often focus on a generic, one-size-fits-all approach to presenting telemetry data. While this can offer some insights, it rarely provides a comprehensive, service-centric view necessary for today’s complex environments. Chronosphere Lens shatters this paradigm by dynamically generating perspectives that are just aligned with the unique service architecture of each company but are also tailored to individual developers’ mental models.
Dynamically generated, service-centric perspective
What sets Chronosphere Lens apart is its ability to dynamically curate information based on your actual services and their interdependencies. No longer do you have to switch between different dashboards and cobble together a fragmented view of your system’s health. Chronosphere Lens understands the intricacies of your specific architecture and distills this into actionable insights presented in an intuitive, unified view.
With Chronosphere Lens, you can see how data flows between services, quickly isolate bottlenecks, and dive into the health and performance of each individual service. This level of insight streamlines your approach to system management, drastically reducing time-to-detection and time-to-remediation, particularly in environments where milliseconds of latency or minor misconfigurations can have cascading impacts.
Resonating with developers
Developers are at the heart of any organization’s success, and Chronosphere Lens speaks their language. First, it provides dynamically generated, service-centric views extracted directly from telemetry data, granting developers immediate context. Secondly, Chronosphere Lens goes a step further by transforming raw data into distilled insights, saving developers from sifting through irrelevant metrics or unrelated traces. In doing so, Chronosphere Lens minimizes cognitive load, allowing developers to focus more effectively on what they excel at: building groundbreaking products.
Chronosphere Lens is not just another feature — it’s a complete rethinking of what observability should be in a cloud native era.
Going beyond metrics and traces: The importance of Events
As part of our continued commitment to provide all of the necessary context and information to quickly remediate issues, we are thrilled to announce the latest addition to Chronosphere: Events. Metrics and traces have been the backbone of observability, but they only tell part of the story. With the introduction of Events, developers can now quickly answer the question of “what changed with my service?” while troubleshooting incidents.
A new layer of telemetry data
What is an Event anyways? Events capture discrete changes to your system, your workload or your observability platform — whether it’s an auto-scaling action, a configuration change, a feature flag, a change in your observability system, or even a business activity. Events are perfectly paired with metrics and traces to provide a snapshot of what else was happening during key moments, which provide context that could be the missing piece in solving the puzzle of complex system behaviors.
Real world examples of how Events help speed troubleshooting
Integrating Events into Chronosphere significantly amplifies the depth and breadth of your observability toolkit. For example, you can correlate a spike in latency metrics with a configuration change event to immediately identify the action required to mitigate the issue, and in many cases the root cause. Or, you might use events to annotate deployment activities, thereby offering contextual clues when analyzing traces. Events could even represent business activities like a site-wide sale happening at an e-commerce site, that might explain otherwise anomalous performance.
The addition of Events not only enhances your capacity to debug and optimize but also provides a historical context that can be invaluable for compliance, auditing, and retrospective analysis.
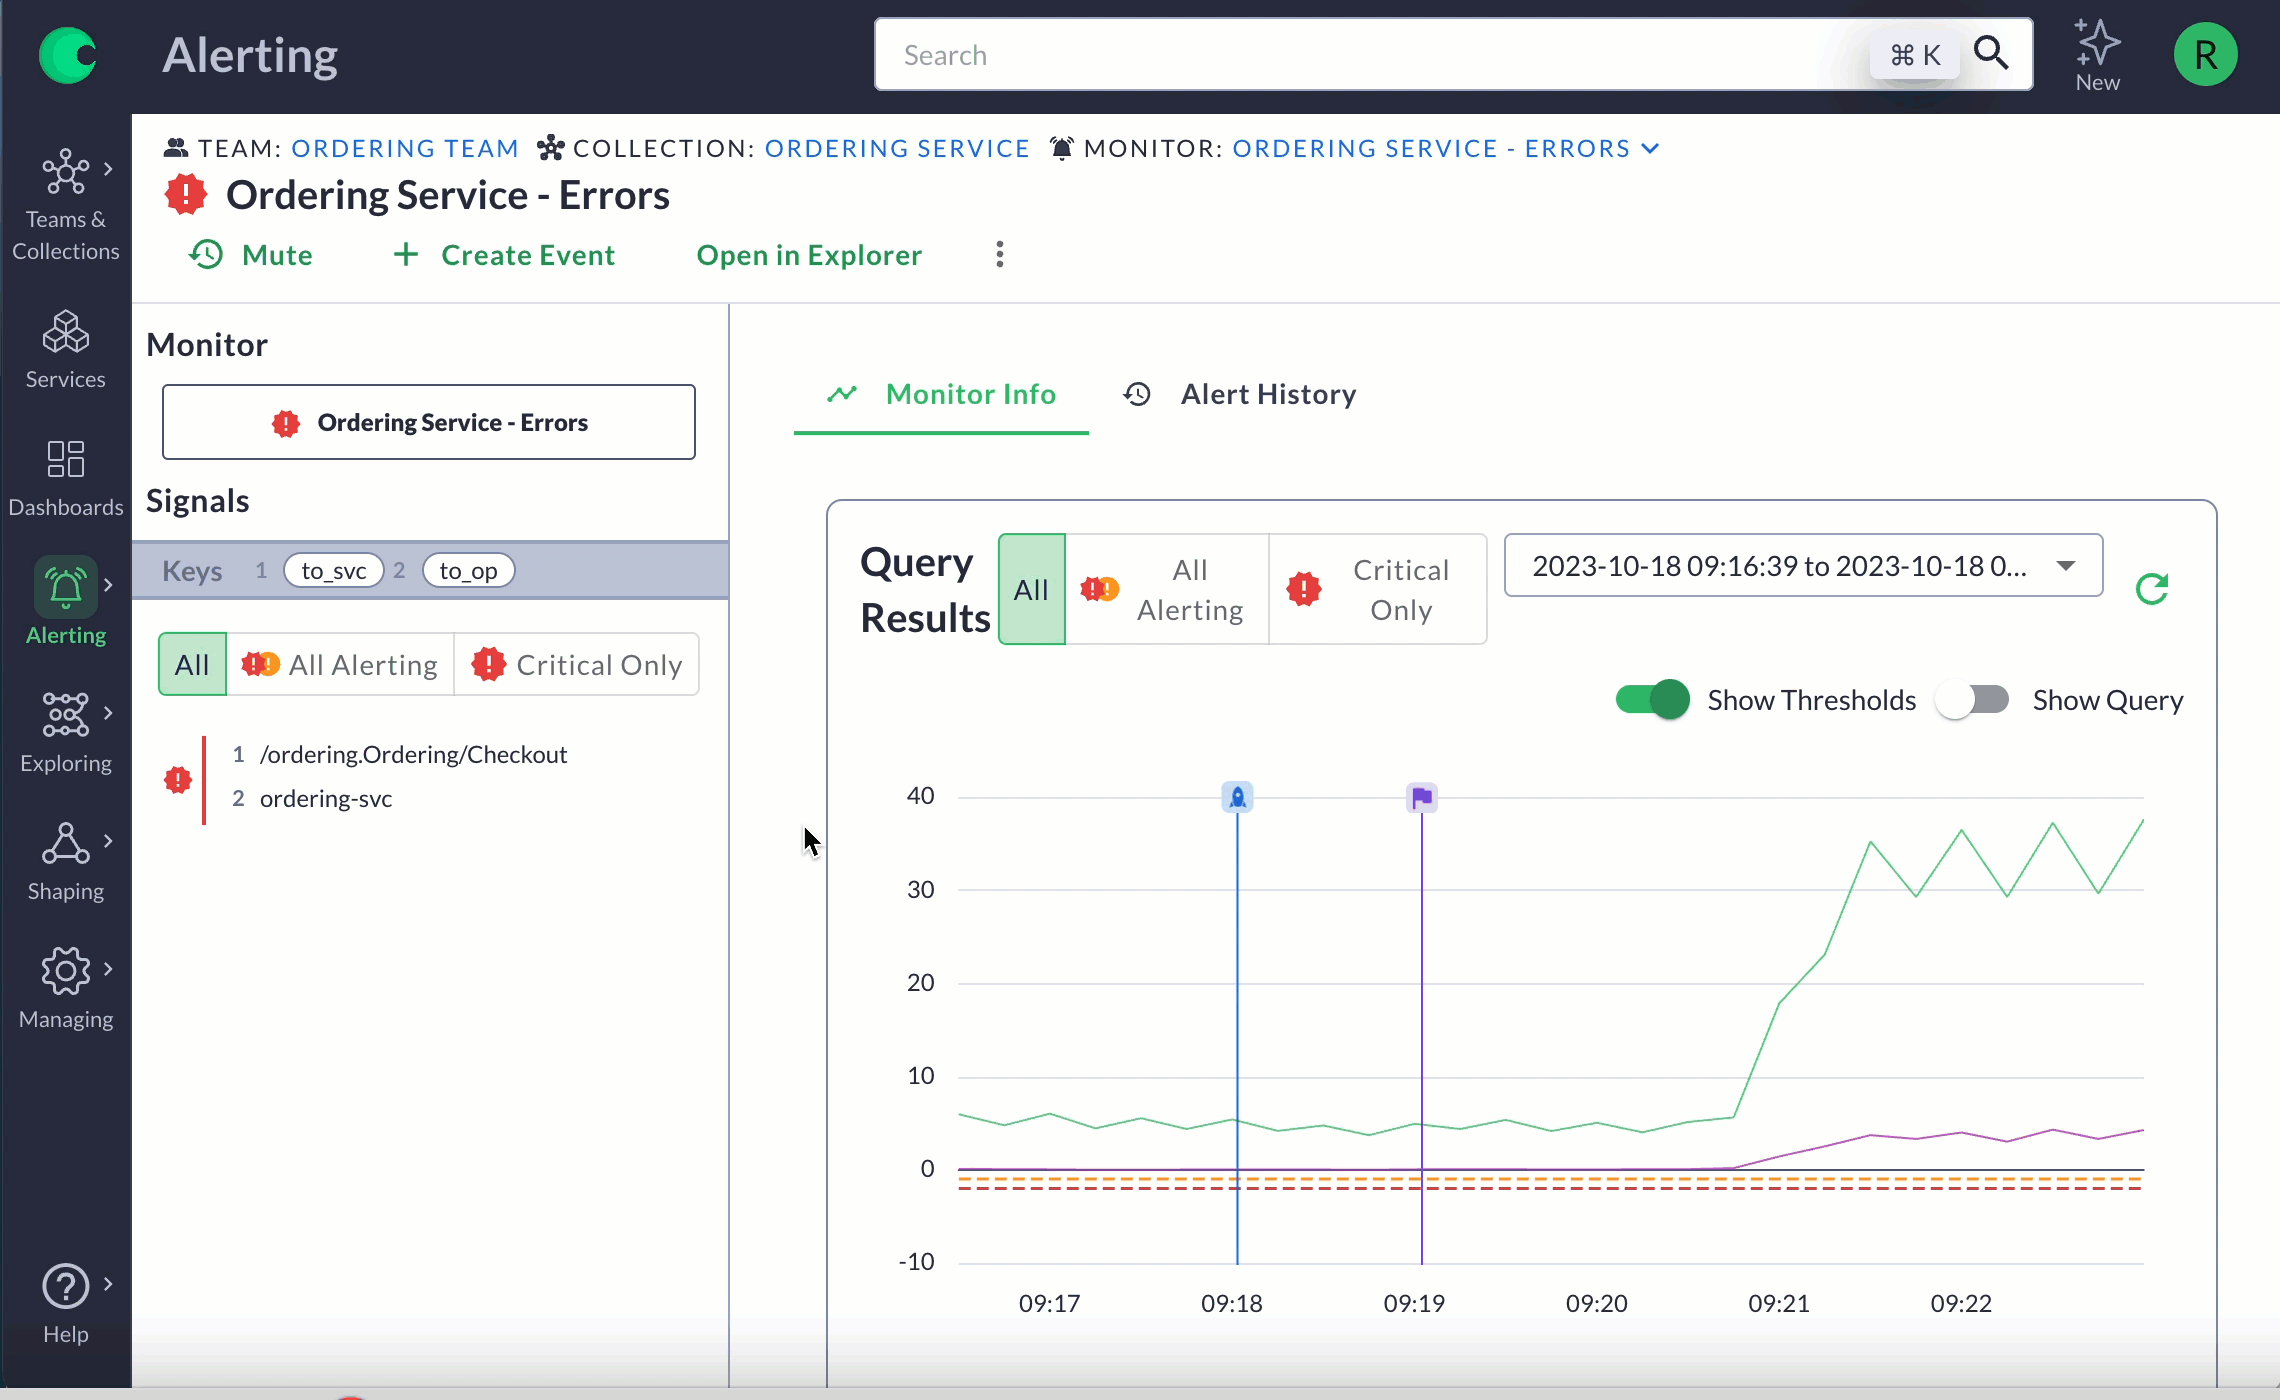
Change Event Tracking
One of the capabilities we’re introducing alongside the ability to ingest Events telemetry is Change Event Tracking. In an environment where the only constant is change — be it code deployments, configuration adjustments, or resource scaling — understanding the impact of these changes is crucial. Enter Change Event Tracking, a feature designed to offer real-time insights into the ripple effects that alterations in your system can create.
The need for Change Event Tracking
In the era of cloud native technologies, the rate of change is not just fast; it’s staggering. Continuous integration/continuous delivery (CI/CD) pipelines pump out new code multiple times a day per service, configurations are perpetually tweaked, and infrastructure scales up and down within minutes. While this dynamism is a boon for innovation, it also brings along the specter of unintended consequences. An innocuous change could unexpectedly topple over a series of dominoes leading to system degradation or even failure. In fact, those system changes, often recorded as events, are the leading culprits behind customer-facing issues.
Change Event Tracking aims to be the guardian against such unpredictability. It allows you to tag, monitor, and analyze changes in real-time, thereby providing an immediate understanding of their impact— positive or negative.
How it adds another dimension to observability
With Change Event Tracking, you don’t just have a log of events; you have a dynamic timeline that correlates and overlays these changes with metrics and traces. Let’s say you rolled out a new version of your service. This feature would not only track this event but also juxtapose it against key performance indicators. If latency suddenly spikes or if error rates go up, you’d know exactly what caused it, allowing for quick remediation.
Unleashing the power of proactive monitoring
Change Event Tracking isn’t just about crisis management; it’s also about leveraging opportunities. You can use this feature to detect positive outcomes of a change, such as performance improvements or resource optimization. By having all this data at your fingertips, your team is empowered to make data-driven decisions with increased confidence.
Customer testimonial
“Chronosphere’s new Change Event tracking capability ultimately helps us deliver the best possible patient experience at scale,” said Jack Pierce, Senior Engineer at Dandy. The new capabilities have provided a leap in operational efficiency. Now our developers can quickly identify recent changes and correlate them with system behavior, significantly improving incident response times and making long standing issues easier to debug.”
Get started with Chronosphere’s next-gen observability features today
You’ve read about the new capabilities we’re introducing — from the uniquely insightful Chronosphere Lens to the transformative power of Events and Change Event Tracking. These are not just features; they are the building blocks of a new paradigm in cloud native observability. But reading about it is one thing; experiencing it is another. Take the next step.


