")

The open source Prometheus monitoring system has become the de facto standard for monitoring cloud native environments. With its highly dimensional data model, it can give you great insights into your systems and services for the purposes of alerting, dashboarding, and debugging.
Most organizations adopting Prometheus start out by deploying a single Prometheus server to monitor their entire infrastructure. A large Prometheus server can comfortably scale to millions or even tens of millions of time series, so this straightforward solution can be remarkably effective.
However, at some point you will run into three main limitations of such a setup: First, as you increase the size of your infrastructure and increase the level of detail at which you collect data about it, Prometheus will eventually bump into the scaling bottlenecks of a single machine.
The second challenge is data durability: Since Prometheus has no built-in data replication mechanism, you may encounter data loss as the result of individual machines or hard drives failing.
Third, attempting to scale out your monitoring by spreading the load over multiple Prometheus servers can make it harder to find the metrics you are looking for.
In this article, I will delve into these challenges in more detail and will highlight a number of strategies for scaling Prometheus on your own — both using standard Prometheus servers as well as additional open source solutions such as Thanos and Cortex.
Since each of these approaches comes with its own set of drawbacks and difficulties, I will also explain why you may at some point want to outsource your Prometheus scaling woes to a competent observability provider.
Challenges with large Prometheus setups
Prometheus was intentionally designed so each server runs as an independent, single-node system. This keeps the system architecture simple and avoids complex clustering and data replication logic between individual server nodes.
To achieve high availability for alerting purposes, you can still run two identical Prometheus servers with the same data collection and alerting configuration, and as long as one of them is healthy you will still get alerted about any issues.
However, this design means that each individual Prometheus server is inherently limited by the scalability and data durability of a single machine:
- Even a large machine will eventually run out of disk space, memory, or CPU capacity. First, your dashboards and queries may become increasingly sluggish for setups under high load. And since a machine’s memory usage usually represents the primary scaling bottleneck for Prometheus, you may also experience periodic out-of-memory (OOM) crashes for servers which have been pushed too far — either by collecting too many metrics or handling too many large queries. Both scenarios can become a major source of frustration for Prometheus operators and users alike.
- Individual machines can and will eventually experience faults, in which case you can lose all collected metrics data on the machine. While you can run multiple highly available Prometheus server replicas next to each other to guarantee high availability for alerting, they will not replicate data between each other after one has had an outage, and you usually just end up having to accept occasional gaps in your monitoring data.
- The scalability and durability limits mean that a native Prometheus server is also not a great long-term storage solution: When trying to use Prometheus to store large-scale data over multiple years, you run the risk of either bumping against the reliability limits of a single machine or against its maximum disk size.
- Prometheus has no concept of multi-tenancy or per-user overload controls. This means that a single metrics source or a user sending heavy queries can take out your entire Prometheus server — affecting even unrelated users on the same server.
If you find yourself running into these scalability and reliability challenges of a single-node Prometheus server setup, it is time to look into scaling and clustering strategies. The only two mentioned solutions that are fully and seamlessly horizontally scalable are Cortex and Chronosphere, so let’s explore the most common solutions, both on-premises and in the cloud.
Scaling Prometheus on your own
There are a number of ways to scale and harden Prometheus setups that you can deploy and manage yourself — either using standard Prometheus features or by integrating with additional Prometheus-compatible systems such as open source Thanos or Cortex projects. Let’s get an idea of the challenges and limitations of each of these approaches:
Functional sharding: Splitting Prometheus servers by use
As a first step beyond a single Prometheus server, you may want to run many smaller servers that each only monitor a single geographic region, cluster, service, or a combination thereof:
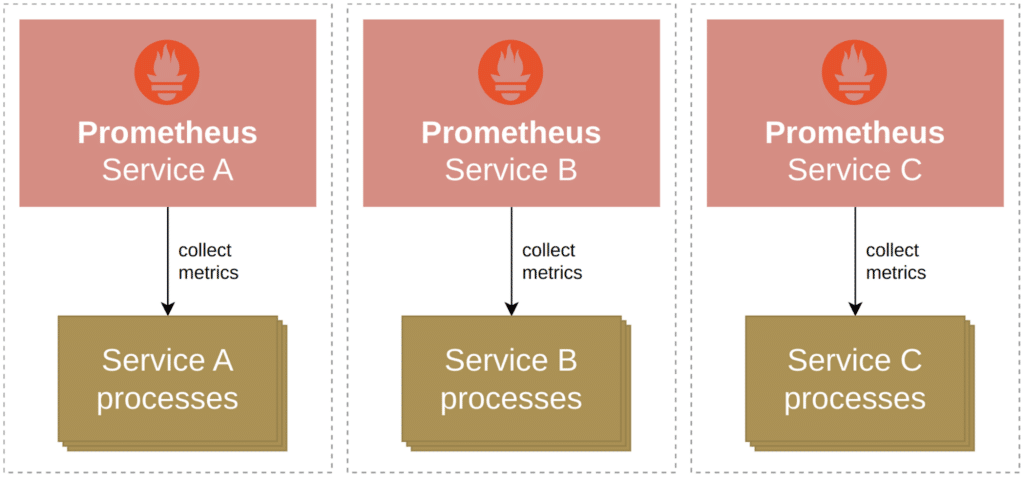
This is called functional sharding and addresses some of the mentioned scaling bottlenecks:
- You can now spread your monitoring load over multiple machines, increasing the total available capacity for collecting and processing metrics data.
- Each team, service, region, or other functional sharding boundary now has their own Prometheus server — this additional level of isolation means that it’s harder for one user to overload your monitoring system and ruin the party for everyone else.
However, simply splitting up Prometheus servers by use doesn’t solve all issues and introduces a new set of problems:
- Your metrics are now spread over a potentially large number of machines and servers, making it harder to discover all metrics that exist in your organization. It is also more challenging to find a specific metric you are looking for if you don’t know in which server it lives.
- Compared to a horizontally scalable system that elastically shares a set of nodes, the individual Prometheus servers will not be able to share unused capacity in the same way. This can lead to a worse overall utilization of your compute resources.
- Sharding your Prometheus servers by their location or function does nothing to address data durability concerns.
Thus, most organizations don’t stop at functional sharding strategies but look at further solutions.
Federation: Building hierarchical monitoring trees
Prometheus’ federation feature allows you to scrape selected metrics from one Prometheus server into another. Especially in the earlier days of Prometheus — when there was a dire lack of better solutions — operators frequently used federation to build hierarchical monitoring topologies for scalable metrics collection.
For example, you might deploy one Prometheus server per cluster to monitor all services in that cluster, and a global Prometheus server to pull aggregated metrics from those per-cluster Prometheus servers:
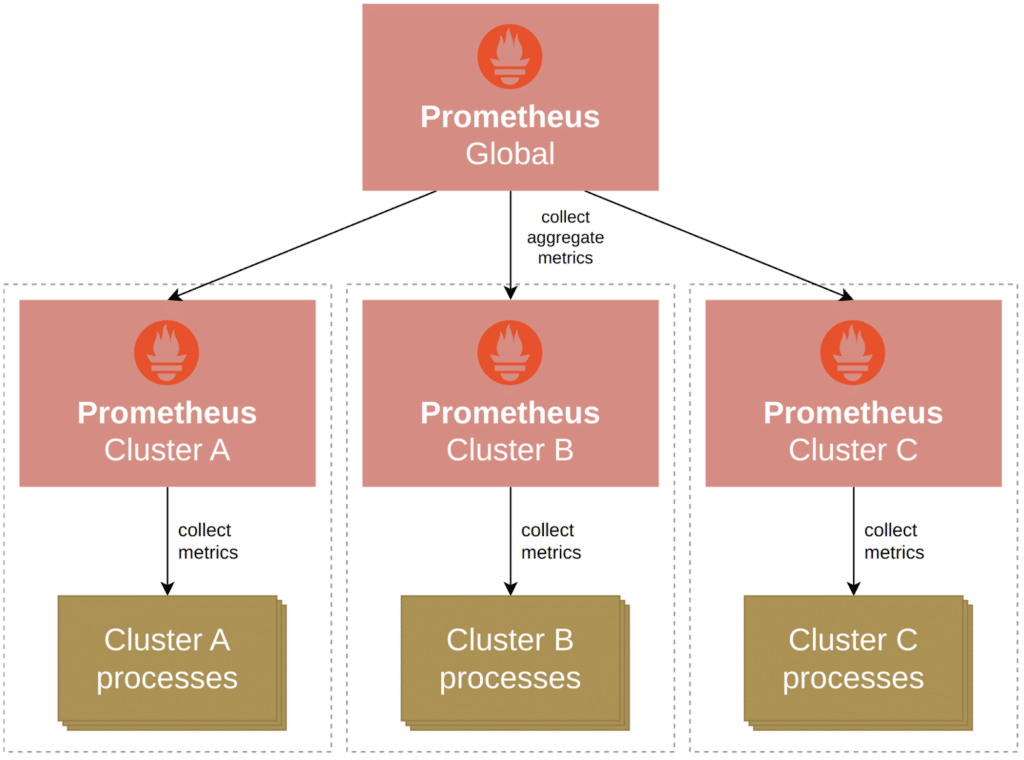
In this scheme, the lower-level servers would have a fully detailed (but local) view of everything that is happening within their cluster — down to the process-level detail. On the flip side, the top-level Prometheus server would have a global view of the entire environment, but would lack certain per-process details. This way you can build scalable monitoring topologies that allow for detailed local monitoring while still maintaining an albeit less-detailed global view.
This is better than a completely disconnected set of individual Prometheus servers, but still does not address data durability, fully detailed global metrics discovery, and other concerns. Let’s see how we can do even better.
Thanos: A scalability layer with an integrated query view
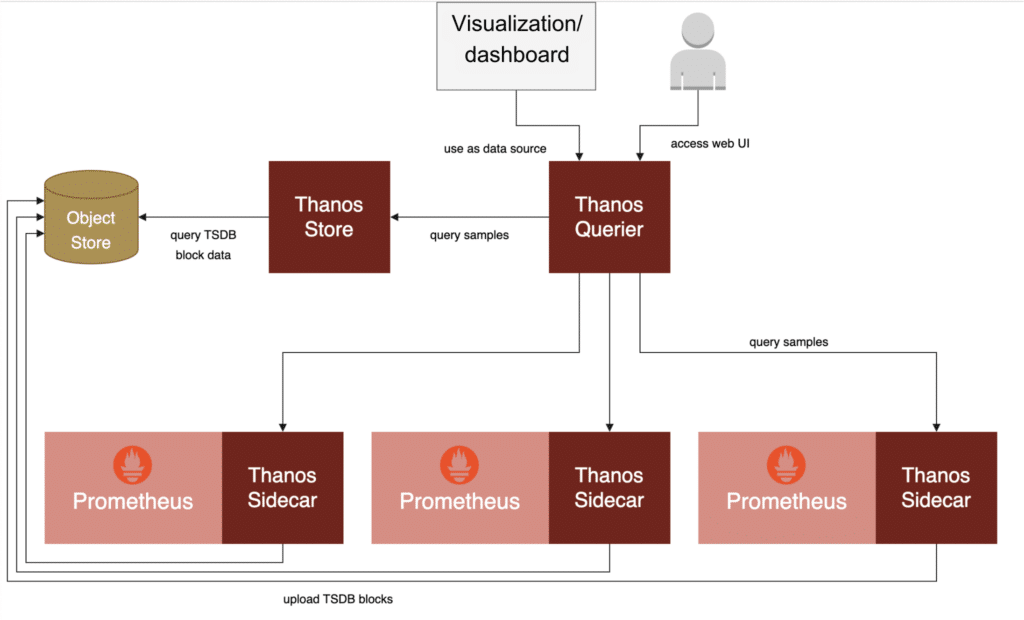
To address the limitations of functional sharding and federation, engineers associated with the Prometheus project created the open source Thanos project. Thanos allows you to keep operating a distributed set of Prometheus servers as before, but adds an integration layer on top of these servers that aims to provide:
- A global query view over the metrics of multiple Prometheus servers.
- Durable long-term storage capabilities via object storage integration.
- Merging of data from highly available Prometheus server replicas of the same type.
With Thanos, recent metrics data still lives primarily in a set of individual Prometheus servers, but chunks of less recent data can be backed up to an object storage system (such as AWS’ S3 or Google’s GCS). The global Thanos query layer then allows you to query the data from all connected Prometheus servers and the long-term storage in an integrated and transparent way:
Thanos solves the global metrics discoverability problem and thus allows you to build scalable Prometheus monitoring setups while still being able to find and query all your metrics at once. For most people looking for an on-premises solution to scale Prometheus, Thanos ends up being the best and most popular option. Of course, Thanos still requires individual Prometheus servers to house recent data, with each server being limited in scalability and isolation between its users. It also still puts you in charge of having to manage your overall monitoring setup and the large amounts of data it produces.
Cortex: A centralized, horizontally scalable solution
As an alternative to Thanos and tying together many individual Prometheus servers into an aggregated view, the Cortex project aims to offer you a centralized, clustered metrics storage service that is compatible with major Prometheus’s APIs such as the PromQL query language.
With Cortex, you may still want to run individual Prometheus servers for collecting metrics from services, but these servers don’t need to store data locally anymore. Instead they can simply forward all collected metrics to the central Cortex cluster. Cortex then takes care of storing the received data in an efficient, durable, and horizontally scalable manner:
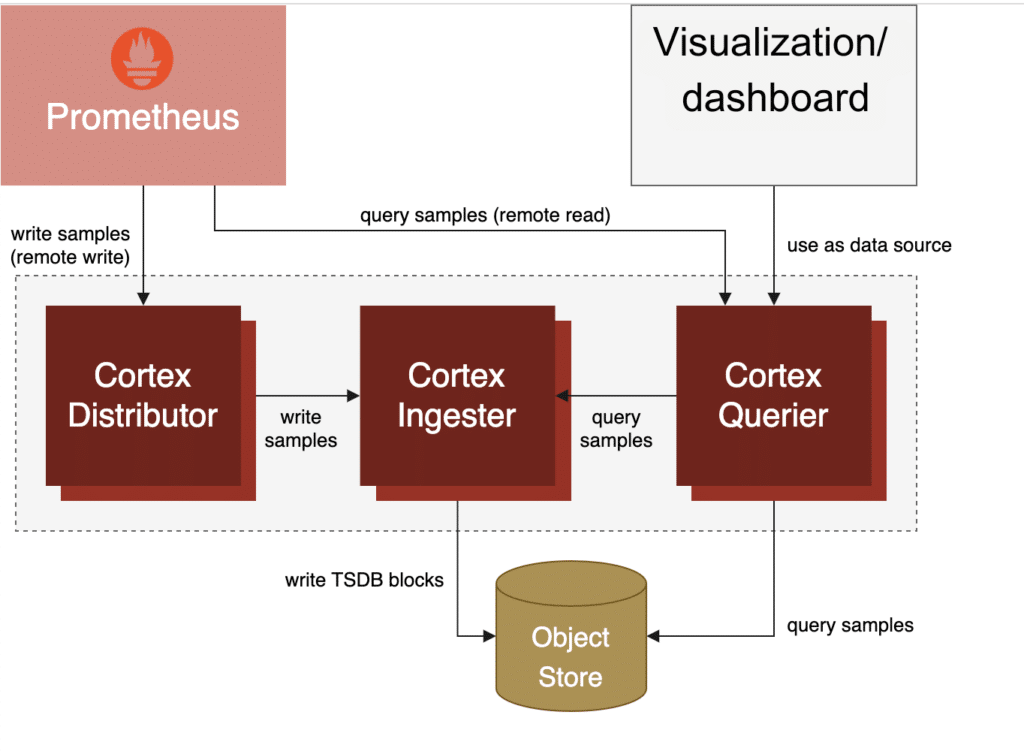
Cortex is horizontally scalable and designed as a multi-tenant system with good resource isolation between different users. It comes with many knobs and settings that allow you to control exact per-user limits for time series counts, sample ingestion rates, and maximum query sizes.
The main downside of Cortex is that it introduces a complex, tightly clustered system that can get complicated to operate. Usually it only makes sense to manage a Cortex installation yourself if you want to create a Prometheus-as-a-service style offering within a larger organization and you have a dedicated team of people to manage the centralized Cortex cluster.
Whitepaper: Getting Started with Fluent Bit and OSS Telemetry Pipelines
Getting Started with Fluent Bit and OSS Telemetry Pipelines: Learn how to navigate the complexities of telemetry pipelines with Fluent Bit.
Getting help with scaling with Chronosphere
As I pointed out, there are many approaches for achieving more scalable and resilient Prometheus monitoring setups using open source tools and systems. However, all of these approaches still put an increasing burden of operating complex software and infrastructure stacks on you and your organization. This may include having to stand up on-call rotations and running troubleshooting and recovery operations only to make sure that your monitoring system is available and working correctly around the clock.
Unless you are in the business of building monitoring infrastructure, you may want to use your valuable engineering resources in a more productive way and outsource this management burden to a hosted observability provider like Chronosphere.
Chronosphere offers a 100% Prometheus compatible platform as a service, operated by a dedicated team of professionals who have nothing else in mind than the scalability, reliability, and cost efficiency of your Prometheus monitoring data.
Chronosphere allows you to either run one or multiple standard Prometheus servers in your infrastructure to collect data locally and forward it to the managed cloud service, or you can also choose to use Chronosphere’s dedicated collector process for this purpose:
The Chronosphere platform then takes care of storing your monitoring data in a cost-effective way while providing you detailed metrics ingestion and aggregation controls to help you stay on top of your time series costs. Once the data is ingested, Chronosphere allows you to query it, build dashboards around it, and define Prometheus-style alerting rules on top of it.
Chronosphere helps organizations run their Prometheus so deployments are consistently available, cost effective, efficient, and scalable.
Availability is their highest priority, as an observability solution that is down provides zero value. The company offers a 99.9% uptime SLA and then strives to overachieve on that number. Last year, they delivered greater than 99.99% uptime to our customers. That’s less than 1 hour of downtime for the entire year!
Their features also help teams add ingestion controls and view detailed cost records. Snap Inc. worked with Chronosphere and was able to reduce data volumes by more than half and saved thousands of engineering hours while deploying observability at scale. Using Chronosphere’s Control Plane, the team defines what data labels are most important and which are noise, making it faster and easier to triage issues while significantly reducing costs.
Abnormal Security was able to have an overall improved experience with efficiency and scalability after their switch to Chronosphere. They reduced mean time to remediation and mean time to remediation by at least 80% based on service-level objectives; flatten large spikes in metric volume; and load dashboards 8-10x faster. Plus, with the Chronosphere Collector on ECS, their developers have a clear, predictable scale of resources and improved uptime.
Conclusion
While an individual Prometheus server can be remarkably effective for monitoring a fairly large infrastructure, you will eventually run into the scalability and reliability limitations of the machine it is running on.
I explained a number of ways to address these limitations yourself, ranging from splitting up Prometheus servers by their use, all the way to deploying Thanos or Cortex alongside Prometheus to achieve high scalability, robustness, and a global query view.
Ultimately, building out a scalable Prometheus setup yourself still requires a lot of dedication and forces you to become an expert in running your monitoring stack — rather than being able to focus on your core business. This is where Chronosphere comes in — it offers you a fully managed Prometheus-compatible observability solution that can handle your Prometheus data at any scale, while being cost effective and reliable.
For more information on Prometheus, check out the following articles from Julius:
Whitepaper: Breaking Vendor Lock-In with Prometheus
Get the tools you need to adopt open source and break free of your observability vendor


