

If you’re starting out with cloud native technologies like Kubernetes, you are going to need a monitoring system that is capable of monitoring both your infrastructure and the services that run on top of it. Prometheus is an open source metrics-based monitoring and alerting stack that has become the de facto standard tool of choice for monitoring cloud native infrastructure and environments.
This article dives into five reasons that make it a no-brainer to choose Prometheus as part of your monitoring strategy when adopting cloud native technologies:
- Kubernetes and Prometheus work together seamlessly since they have excellent cross-support for each other.
- Prometheus comes with a powerful query language that allows you to flexibly select and transform your metrics data for dashboarding, alerting, debugging, and other use cases, in a unified way.
- Prometheus’ large adoption and mature ecosystem make it easy to find existing solutions for a variety of use cases or to get help from the community.
- The de facto standardization and portability of Prometheus make it possible to build your monitoring pipeline around a common standard while still being able to switch and migrate between compatible implementations with different tradeoffs as needed.
- Open source and open governance mean that you can trust the long-term health of the project, inspect and modify its source code, or even get involved with its development community, when needed.
Let’s explore each of these points in more detail!
Seamless integration with Kubernetes
Whether your infrastructure is running on-premises or in the cloud, most cloud native environments use Kubernetes at their core to run services and other compute workloads. This makes it critical to have a monitoring system that integrates well with Kubernetes – both to monitor Kubernetes itself, as well as the services that run on top of it.
Luckily, Prometheus and Kubernetes have excellent native cross-support for each other that enables this need:
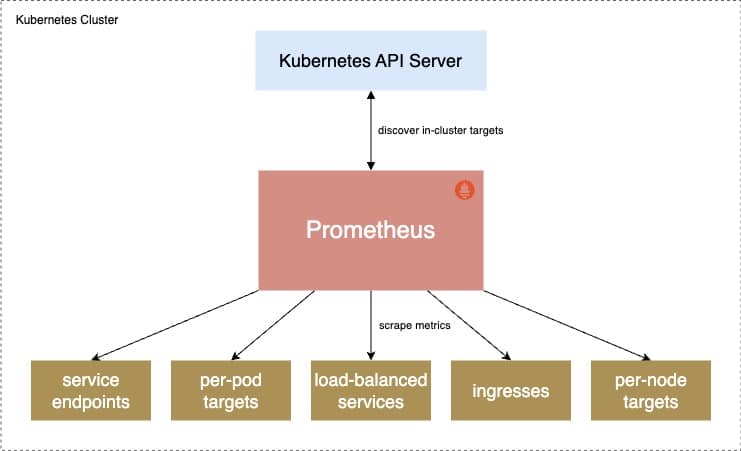
- Prometheus can talk to the Kubernetes API server to continuously discover targets to monitor on the cluster. These targets can be pods, services, endpoints, nodes, and other cluster objects. Prometheus then pulls metrics from these cluster objects over HTTP, while attaching Kubernetes metadata labels to the collected series.
- All major Kubernetes cluster components, from the API server to the Kubelet, expose native Prometheus metrics endpoints out of the box. This allows Prometheus to easily get the best possible insight into the inner state of your cluster components.
This seamless integration between the two systems makes Prometheus an ideal choice for monitoring Kubernetes environments. Most organizations using Kubernetes will integrate with its Prometheus interfaces in one way or another, even if they do not directly use Prometheus as a monitoring server.
Thus, choosing Prometheus produces the least amount of friction when getting started with cloud native environments: It just works out of the box, and you don’t need any translation layers in your metrics collection pipeline that might reduce the fidelity of the collected data.
Powerful querying and precise alerting
After collecting and storing your metrics, Prometheus allows you to query this data in powerful ways using the Prometheus Query Language (PromQL). PromQL is a flexible query language built specifically for selecting and transforming metrics data. It allows you to evaluate operations such as:
- Selecting metrics based on dimensional (label-based) facets
- Computing rates, derivatives, and other transformations over series
- Aggregating over dimensions at various aggregation levels
- Performing arithmetic, value comparisons, and other binary operations between sets of correlated time series data
- Approximating percentiles from histograms
Below is an example of a PromQL query that selects the percentage of HTTP requests that a service has handled over the last five minutes (grouped by the request’s path) that have resulted in an error status code of 500, limited to paths for which that percentage is greater than 5%:
sum by(path, status) (
    rate(
      http_requests_total{job="demo",status=~"5.."}[5m]
    )
  )
/ on(path) group_left
  sum by(path) (
    rate(
      http_requests_total{job="demo"}[5m]
    )
  )
* 100
> 5- Dashboarding: Building fully fledged dashboards for a component or a system, based on the collected metrics data about it.
- Alerting: Building alerting rules based on PromQL to pinpoint problems in your infrastructure precisely and accurately, greatly reducing the signal-to-noise ratio for alerts.
- Ad hoc debugging: Running interactive queries to find out what is going on in your infrastructure right now.
- Capacity planning: Determining how fast your resource usage is growing so you can plan for additional capacity in the future.
- Automation: Automatically scaling services based on their load or auto-remediating detected problems.
Given its capabilities, PromQL can unify many different use cases under a single query language. For example, PromQL is a great fit for:
The flexibility and generality of PromQL make Prometheus a great tool for getting the most use out of your collected metrics data. If you want to learn more about PromQL, you can read my earlier blog post about the top PromQL 3 queries to get you started!
Large adoption and mature ecosystem
We initially created Prometheus in 2012 and fully published it in 2015. This has given the project more than 10 years to become sufficiently mature and stable enough to be adopted as a mission-critical monitoring system in many enterprises. Whether it’s large tech companies, smaller startups, or even traditional institutions and banks, you can find Prometheus everywhere by now.
This large adoption has led to a large community of users and builders springing up who have contributed their own Prometheus integrations. As of December 2023, the Prometheus ecosystem officially includes:
- 960+ exporters (agents that expose Prometheus metrics from existing systems)
- 50+ natively instrumented projects, including Kubernetes
- 20+ instrumentation client libraries
The main Prometheus server open source repository has also accumulated 50K+ stars on GitHub over the years, further showing the project’s massive popularity:
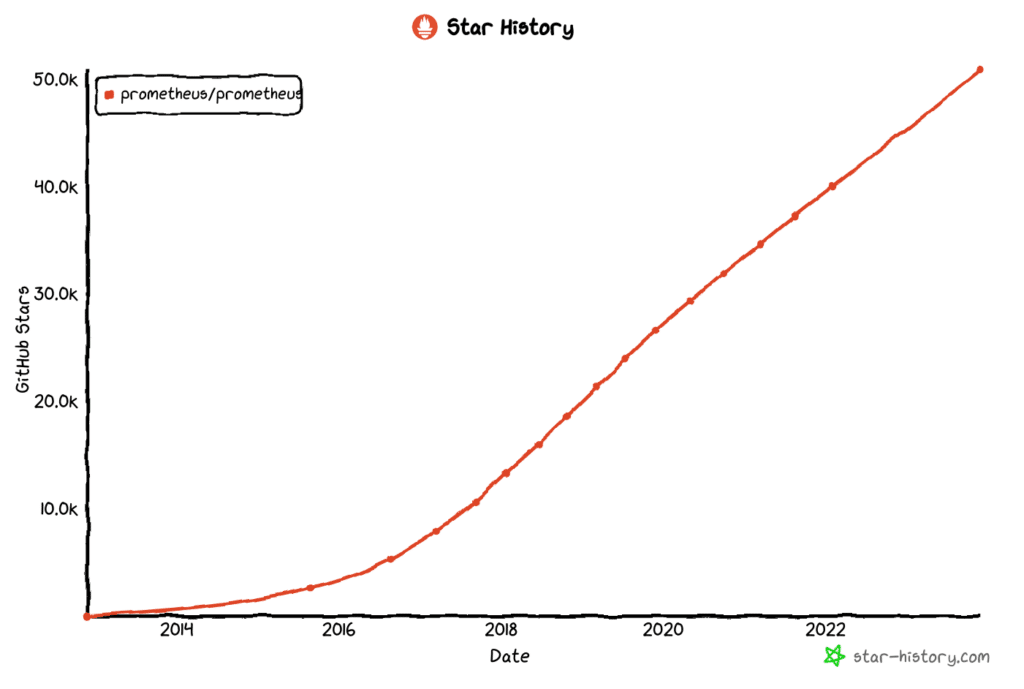
This large adoption and vibrant ecosystem makes Prometheus both trustable and easy to integrate with. Whether you want to monitor a specific software component or integrate your monitoring stack with a third-party system, you are more likely than not to find an existing solution out there to help you out.
De facto standard and portability
Prometheus initially started out as a set of components that talked to each other to collect metrics, store them, query them, send alert notifications, or to write samples into a remote storage system. These components looked like:
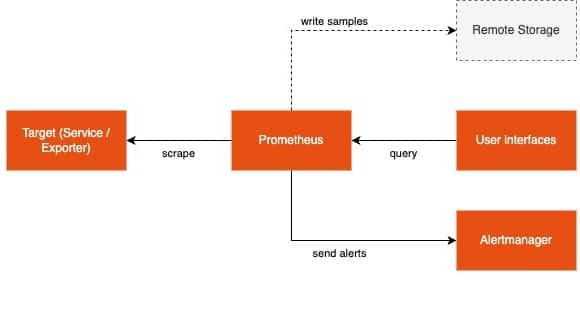
With the growing adoption of Prometheus, users and vendors became interested in integrating with Prometheus in different ways to offer:
- Commercial or open source long-term storage options for Prometheus data.
- Compatible drop-in implementations for the Prometheus server with different tradeoffs or additional functionality.
- PromQL-compatible query interfaces for existing observability platforms.
The result is a shift from viewing Prometheus as a set of specific component implementations, toward a set of interfaces that can be standardized and reimplemented in other systems.
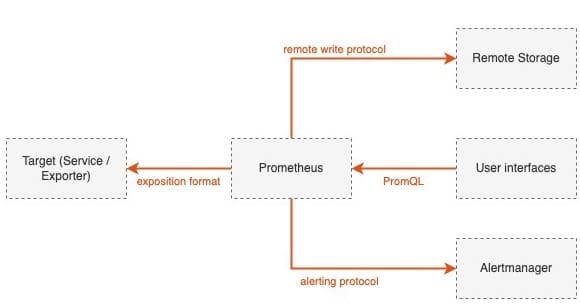
The Prometheus team has done a lot of work toward standardizing these individual interfaces, along with building a suite of technical compliance tests and initiating a formal compatibility certification process that vendors will be able to go through to clarify their level of conformance to potential users.
As a result of this work, the various Prometheus interfaces have become de facto open standards within the monitoring landscape, and many players integrate with them. For example, Chronosphere makes use of Prometheus’ remote write interface to receive data from a Prometheus server, and it also offers a 100% PromQL-compatible querying interface in its hosted observability platform.
This kind of interoperability is great for the Prometheus ecosystem, as you can now find alternative — but compatible — implementations that offer different tradeoffs. For example, one vendor’s solution may be cheaper and simpler than another, while another might be more expensive and complex, but also more scalable. This leads to a larger ecosystem and a healthy competition that makes Prometheus better for everyone involved.
Using an open source monitoring standard is also great for architectural portability: You might start out with a native on-premises Prometheus setup and later decide to move parts of your setup to a compatible cloud service like Chronosphere, without having to re-architect, migrate, or relearn everything. It enables you to standardize on Prometheus-compatible monitoring while being able to freely switch out architectural components as needed.
Open source and open governance
In contrast to many other projects, Prometheus is not only open source, but also openly governed. Here’s what this means and why it matters.
Open source
First of all, Prometheus is open source and available under the permissive Apache 2.0 license.
This means that:
- You can use Prometheus for free for any purpose, forever.
- You can take a look under the hood and see how the project is implemented.
- You can also make changes to the software in case you ever need to.
- If you like, you can even contribute changes back to the project!
While many organizations have realized the benefits of basing their infrastructure on open source software over the last decade or two, Prometheus takes this one step further by adopting an open governance model.
Open governance
Despite being open source, many projects are still controlled by a single company, which frequently leads to conflicts of interest between the health of the project and that of the company. Here are some examples:
- License bait-and-switch: A company may launch and grow a project under a permissive open source license, but then decide to switch the license to a less open one from one day to another. This has recently become a more common occurrence, usually out of a motivation to capture more of the value that the software creates. This comes as a shock to existing users and leaves them frustrated when they have trouble adopting the new license in their organization.
- Business-motivated feature rejection: Similarly, a project controlled by a single company may deliberately reject certain feature contributions to their open source project because it would hurt their business. For example, the company might offer an additional commercial version of their project with extra features that now need to be kept out of the open source version for the company to make money.
- Project abandonment: In the worst case, the company behind a project may go bankrupt, or it may decide for other reasons that the project no longer fits into their business strategy. In this case, a project might get abandoned, without any clear successor to take on its future development.
Contrasting this model, Prometheus is hosted under an open governance framework within the CNCF. This enables many companies and individuals to come together on neutral ground and to develop and maintain Prometheus, as well as care for its community collaboratively. While the CNCF owns the DNS domains, trademarks, and other primary assets of the project, the individual Prometheus team members make the technical and governance decisions around the project working together in the open.
This structure ensures that Prometheus is not owned and controlled by a single company, and it also enables outsiders to participate and eventually even become Prometheus team members. Overall, this means that you can trust Prometheus to be around for a long time, with many stakeholders caring for the project’s health.
Conclusion
In this article, I explained why Prometheus is the natural choice for monitoring cloud native environments. On one hand, Prometheus excels on a technical level, due to its native cross-support with Kubernetes and its flexible PromQL query language. On the other hand, the project’s maturity, wide adoption, and open governance model have created long-term trust in the project and have built a large and growing community around the project.
Finally, with many of the project’s interfaces becoming a de facto industry standard, Prometheus-compatible implementations with different tradeoffs are springing up across the ecosystem. This gives users more choice than ever to choose a solution that suits their needs.
While many organizations begin their cloud native observability journey with open source tools like Prometheus, they quickly run into major hurdles. Challenges faced when running their own open source observability in-house is the significant management overhead and tooling that is unreliable and slow. Chronosphere gives you the best of both worlds: A fully open source compatible solution that relieves the management overview and delivers best in class availability and performance.
For more information on Prometheus, check out the following articles from Julius:


