")

If you use Kubernetes to power your infrastructure and services, you will want to make sure that both the Kubernetes cluster manager and the services running on top of it are always healthy and behaving as expected.
While there are many monitoring systems that you can use to observe cluster health, Prometheus is the most natural choice for Kubernetes environments. Prometheus is a cloud native, metrics-based monitoring system with a flexible data model and powerful query language. Its open source foundation and shared development history make it the ideal Kubernetes partner for cloud native environments.
Let’s explore Prometheus and Kubernetes’ history, look at how the two go together, and learn how to spin up a deployment.
The relationship between Prometheus and Kubernetes
A big reason why Prometheus and Kubernetes are a match made in technology heaven is their shared heritage that traces back to Google:
- Kubernetes took inspiration from Google’s Borg cluster manager, the primary computing platform for running production services at Google.
- Prometheus was influenced by Google’s Borgmon monitoring system, the primary system that Google used to monitor both its Borg clusters and all the Google services running on them.
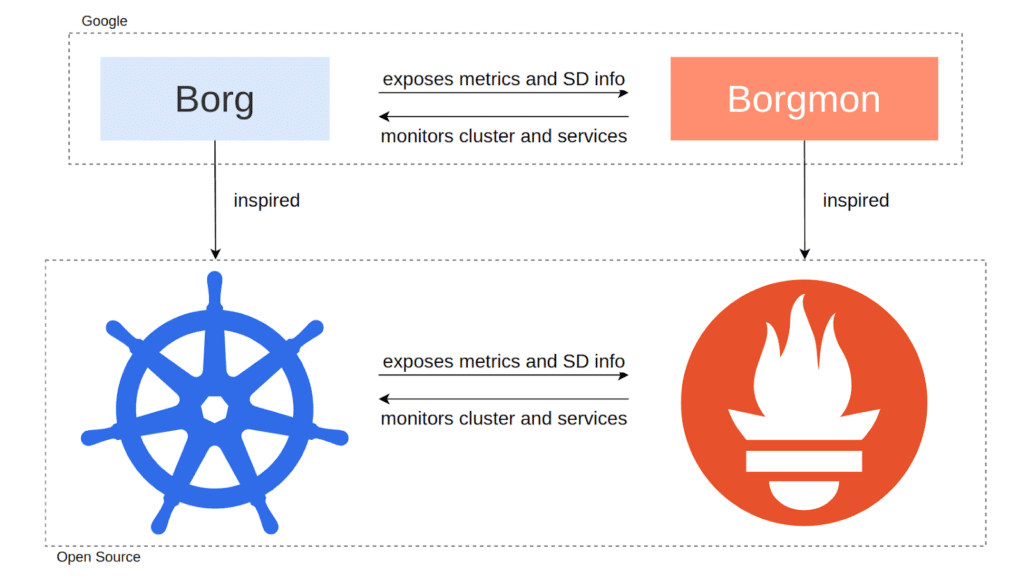
Borg and Borgmon were created to work with each other, so individual designs have carried over in large parts to their open source counterparts. This shared heritage has spurred compatible architectural concepts between Kubernetes and Prometheus.
Kubernetes is a cloud native cluster manager to dynamically run scheduled and rapidly changing workloads, while Prometheus was created to specifically monitor such ephemeral workloads through a cluster manager’s service discovery function. Both systems also feature a label-based data model to identify metrics and cluster objects.
Contributor collaboration from both open source projects started early on, which has led to excellent cross-support, such as:
- Native Prometheus metrics in Kubernetes: All Kubernetes components (Kubernetes API Server, the Kubelets, and etcd) expose native Prometheus metrics about their inner workings over HTTP. Prometheus then scrapes these HTTP endpoints to collect the exposed metrics.
- Kubernetes service discovery support in Prometheus: Prometheus natively continuously discovers services, pods, endpoints, ingresses, and other Kubernetes cluster objects from the Kubernetes API Server. This way, Prometheus gets a constantly updated view of the workloads that should run on the cluster, and it knows how to collect metrics data from them. It also uses the metadata from the service discovery integration to attach identifying labels to the collected time series.
This mutual compatibility means that Prometheus becomes the most natural choice for monitoring your Kubernetes cluster components.
The Prometheus monitoring architecture
Typically, Prometheus runs inside the cluster when it monitors a Kubernetes cluster and the services running on it. This helps avoid networking and authentication issues between Prometheus and the components it needs to connect to within the cluster.
Prometheus then talks to the Kubernetes API Server to discover monitoring targets and then collects their metrics over HTTP endpoints:
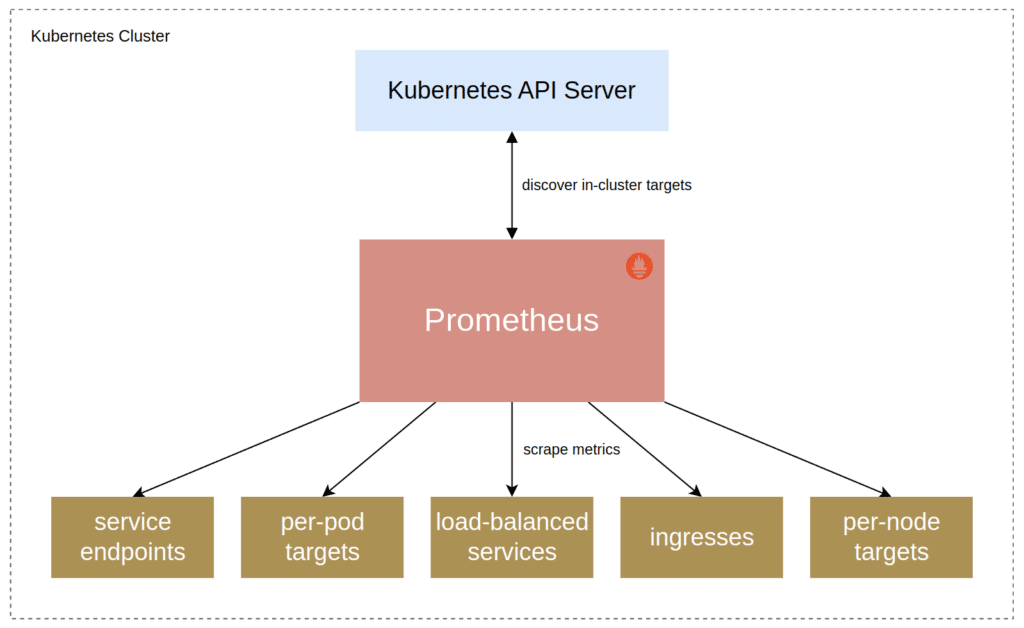
The Kubernetes service discovery configuration in Prometheus supports discovering many different types of targets to monitor, such as load-balanced services over ingresses to individual service endpoints or pods.
Deploying Prometheus on Kubernetes using the Prometheus Operator
In this section, I will give you a quick overview of how easy it is to get started with Prometheus on Kubernetes, and what kind of metrics and functionality you can expect. To follow along and try things out yourself, you will need a Kubernetes cluster (version 1.22 or later) with administrator-level access.
Introducing the Prometheus Operator
Rather than write all deployment manifests on your own (which can get tedious and error-prone), use the Prometheus Operator for deploying Prometheus server deployments on Kubernetes.
The Prometheus Operator is a piece of software that runs on your Kubernetes cluster and allows you to specify your desired Prometheus server deployments and the services to monitor in an abstracted and declarative way using a set of operator-specific Custom Resources.
The Operator then creates the underlying Prometheus server configuration and deploys the Prometheus server to the cluster. It can also deploy and manage a number of related server components, such as the Prometheus Alertmanager for sending alert notifications.
Deploying the Prometheus Operator
The kube-prometheus Jsonnet library is the best way to deploy the Prometheus Operator. Besides customizable library components, the kube-prometheus repository also comes with a set of example manifests in the manifests directory that allow you to quickly deploy the Prometheus Operator, along with an operator-managed Prometheus server, the Alertmanager server, and other related components to a Kubernetes cluster.
Let’s start by cloning the kube-prometheus repository:
git clone https://github.com/prometheus-operator/kube-prometheusChange into the cloned directory and check out a known commit to make sure that you are using the same version as in this guide:
cd kube-prometheusgit checkout 250b874First you need to register the required custom resource definitions (CRDs) with the Kubernetes cluster and then wait until the applied resources are ready to use:
kubectl apply --server-side -f manifests/setupkubectl wait \ --for condition=Established \ --all CustomResourceDefinition \ --namespace=monitoringNow you can deploy the Prometheus Operator, along with some Custom Resources that tell the operator to deploy Prometheus, the Alertmanager, and other related components:
kubectl apply -f manifests/If you like, you can look at the manifests in the manifests directory to get a better idea of what resources are applied to the cluster. For production deployments, you would use the kube-prometheus Jsonnet libraries to generate your own custom manifests with just the components and the configuration that you need.
To check that all pods are running, use:
kubectl --namespace=monitoring get podsThis should output something like:
NAME                                   READY   STATUS    RESTARTS   AGE
[…]
prometheus-adapter-79c588b474-bfp7p    1/1     Running   0          2m19s
prometheus-adapter-79c588b474-p6nhx    1/1     Running   0          2m19s
prometheus-k8s-0                       2/2     Running   0          107s
prometheus-k8s-1                       2/2     Running   0          107s
prometheus-operator-5d7bcbb97c-2xwcw   2/2     Running   0          2m19s
This result shows the Prometheus Operator has actually deployed two Prometheus server replicas (behind a load-balanced service) for redundancy: “prometheus-k8s-0” and “prometheus-k8s-1“.
In the default deployment, these Prometheus replicas monitor all of your Kubernetes cluster components, as well as the Alertmanager and the Prometheus servers themselves. In a real-world setup, you might now also apply a ServiceMonitor Custom Resource to the cluster to collect metrics from your own services as well.
With the following code, expose Prometheus on local ports on your machine so that you can access it from the browser:
# Expose Prometheus on localhost:30000.kubectl --namespace monitoring port-forward --address 0.0.0.0 svc/prometheus-k8s 30000:9090 >/dev/null &Verify that you can reach Prometheus on https://localhost:30000/ in your browser.Whitepaper: Breaking Vendor Lock-in with Prometheus
Get the tools you need to adopt open source and break free of your observability vendor
Querying cluster and service metrics with PromQL
Let’s take a look at querying metrics through the Prometheus web interface using the Prometheus query language PromQL.
The Prometheus server collects resource usage information like the CPU or memory usage for each container running on the Kubernetes cluster. These metrics can be useful for tracking down the biggest resource consumers in your clusters, spotting behavioral anomalies in specific containers, or even for usage-based billing.
Let’s say we are interested in the aggregate CPU usage of all containers, summed up for every namespace. Head to Prometheus on https://localhost:30000/, enter the following PromQL query into the text input box, and press Enter to run the query:
sum by(namespace) (rate(container_cpu_usage_seconds_total[1m]))This should look something like this (in graph mode) and shows you the per-namespace container CPU usage in cores:
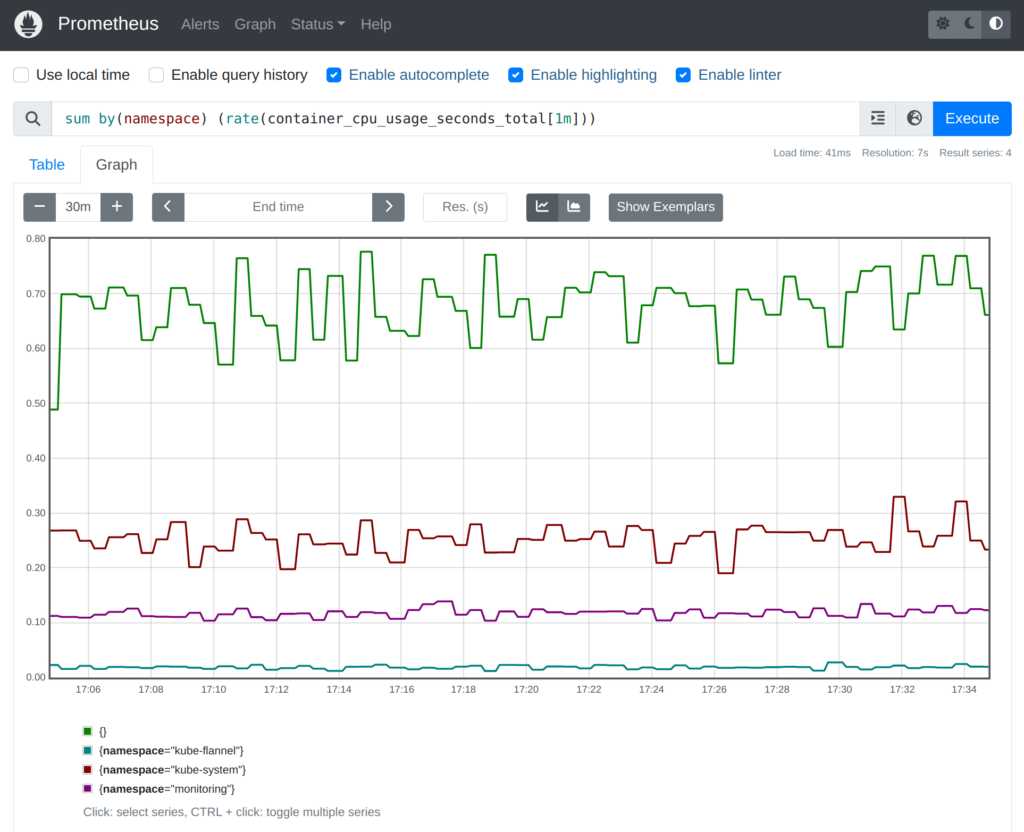
You can experiment with switching between the tabular and graph mode in the Prometheus expression browser.
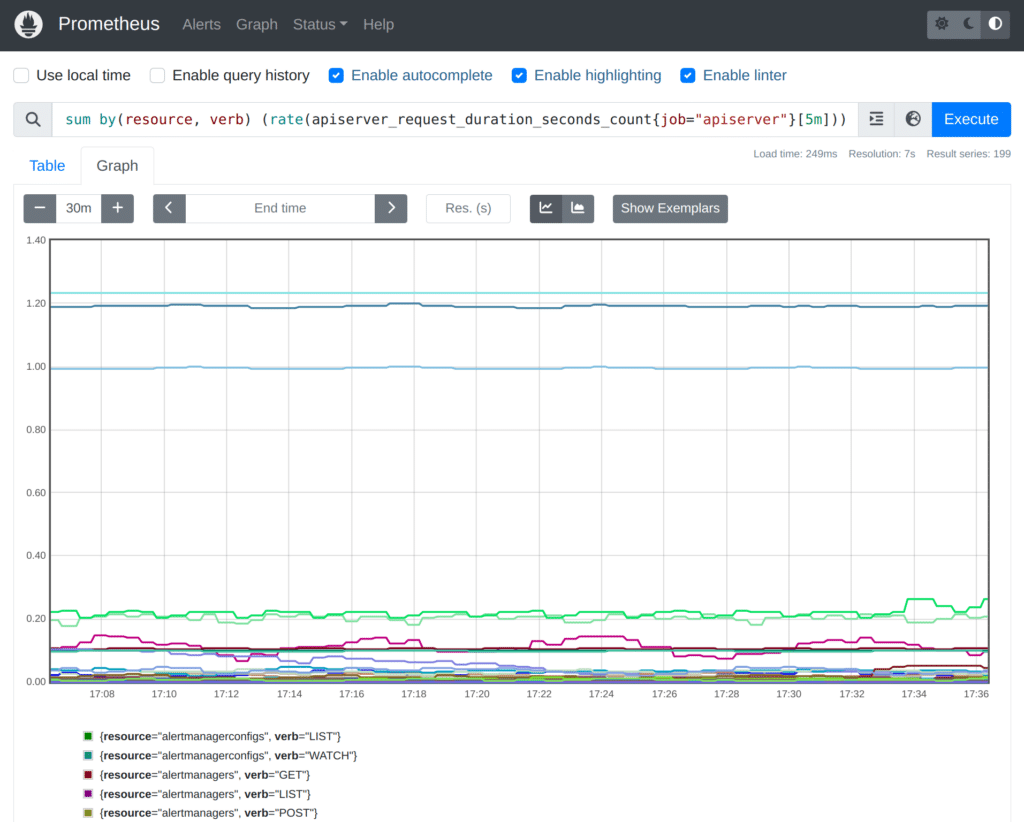
Prometheus also collects hundreds of metrics about the Kubernetes API Server that tell you how the API Server is communicating with other server components, as well as how it is behaving internally, to let you monitor its health. Some example metrics include:
apiserver_request_duration_seconds_count: The total number of requests handled by the API Server, broken out by the API verb, resource type, and other label dimensions.etcd_requests_total: The total number of requests the API Server has made to etcd, broken out by the operation and resource type, as well as other dimensions.kubernetes_feature_enabled: A metric telling you for every Kubernetes feature and namespace whether the feature is enabled in that namespace (value of 1) or disabled (value of 0).
For example, we could query for the per-second rate of requests that the API Server is currently handling (split out by resource type and verb) like this:
sum by(resource, verb) (rate(apiserver_request_duration_seconds_count{job="apiserver"}[5m]))The result should look somewhat like this:
Prometheus also monitors the health of each host’s Kubelet (the daemon responsible for running Kubernetes containers on each host). For example, you could see the number of performed runtime operations for each Kubelet like this:
rate(kubelet_runtime_operations_total{job="kubelet"}[5m])The result should look somewhat like:
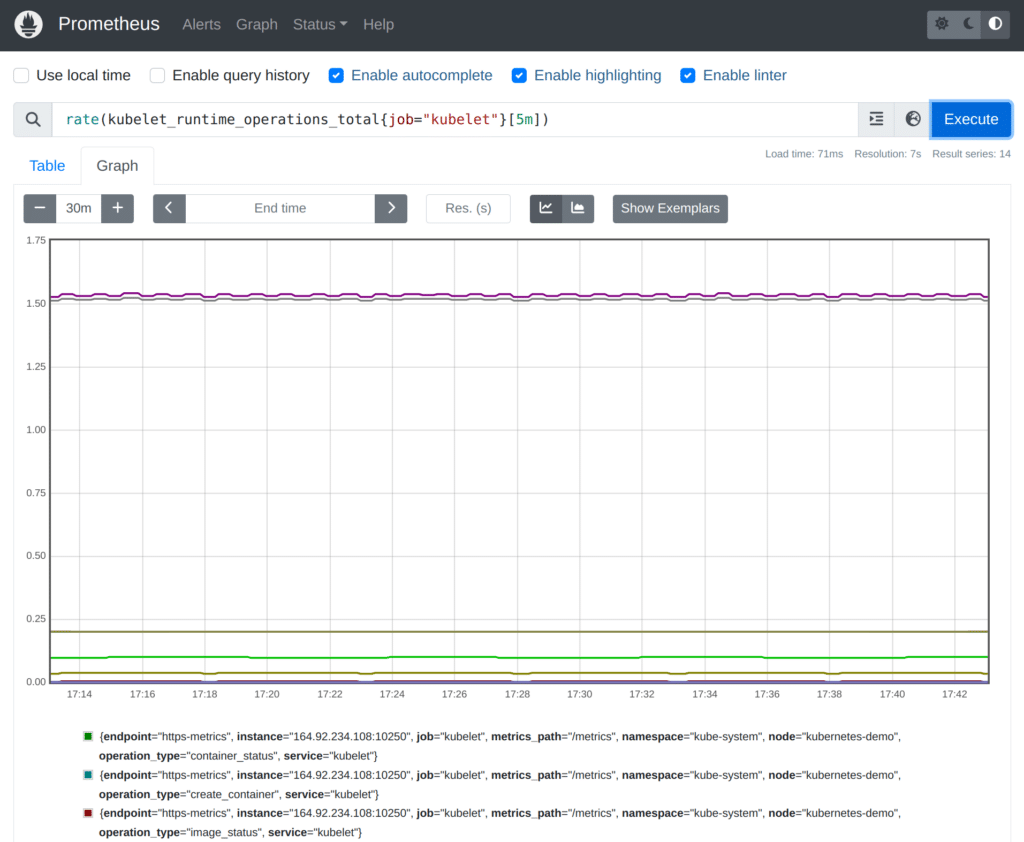
There are many other metrics that the Prometheus server collects, or that you could expose from your own applications, but this should give you an initial idea of what using the Prometheus server UI with Kubernetes-based metrics looks like. Prometheus’ built-in web interface is great for running ad-hoc queries for understanding and debugging your systems.
Conclusion
As we saw in this article, Prometheus is an excellent and natural choice for monitoring Kubernetes clusters and the services running on them. Both systems share a common design history at Google. Additionally, both systems have implemented excellent mutual support: Kubernetes components expose native Prometheus metrics, while Prometheus can automatically and continuously discover and monitor service endpoints and other cluster objects on Kubernetes clusters.
Using the Prometheus Operator and the kube-prometheus project, we learned how to get started with deploying Prometheus on Kubernetes. We then had a first look at querying some of the metrics that Prometheus collects and saw how they could be useful for monitoring the health of the cluster.
Having these metrics – and using systems that are designed for cloud native environments – make it easier to see how well your cloud native environments are running so you can proactively manage them to avoid service downtime or outages.
For more information on Prometheus, check out the following articles from Julius:
Manning Book: Fluent Bit with Kubernetes
Learn how to optimize observability systems for Kubernetes. Download Fluent Bit with Kubernetes now!


