

In my last blog on high cardinality, we’ve talked about how to scale up your observability function safely and quickly. Surprisingly, scaling often has more organizational aspects than technical challenges – assuming the observability platform can cope with the growth.
In this post, we’ll take a deeper look at some of the ways to make sure your metrics platform is in good shape (and stays in good shape) as the adoption of the shared platform increases across the organization.
Resiliency matters
First and foremost, resiliency and availability of the platform matter. Even if it’s not a production app itself, it’s used to observe production apps in times of duress. That implies that the metrics system has to be available to troubleshoot and triage services as issues occur: the metrics system is a critical system that engineers rely on to fix problems with the production apps.
Teams can apply simple design principles, requiring the metrics system to run in a different availability zone, without dependencies on any of the production systems (including things like DNS, networking, and traffic management). This way, when a production application or one of its dependencies has issues, the metrics system is still available in the engineer’s toolbox to use. It also requires making the right decisions on time-series database, ingestion infrastructure, and processing capabilities.
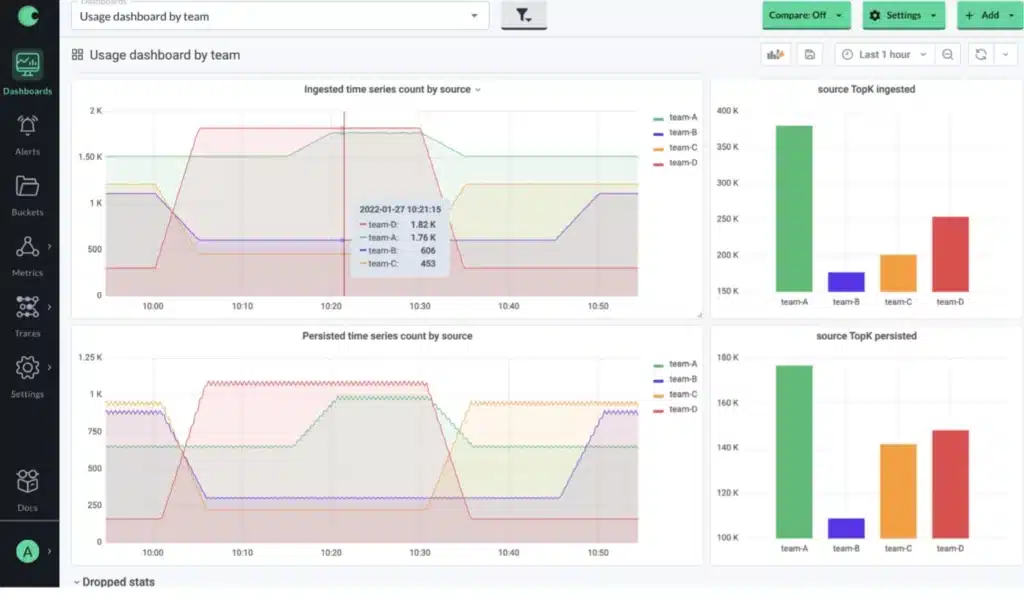
Monitor the monitor
A monitoring system that’s not delivering metrics data to engineering teams is of little use. To make sure the observability platform is (and stays) available to engineering teams, the observability team must monitor the health of the metrics platform continuously, and work to improve the reliability, performance, and security of the platform.
This work includes creating metadata dashboards visualizing data growth trends, query performance percentile graphs, and alerting on ingested data volume and delay between ingestion and being able to query data.
Often, performance issues occur because teams using the platform are emitting too much data or are using inefficient queries and dashboards. This is where the observability team’s superpowers come into play, and can help engineering teams tame high cardinality metrics streams, optimize queries and standardize how teams work. Interested in learning more about how to scale the non-technical aspects? We have a whole blog post for you: How to implement monitoring standards at scale.
Limit writes and reads when needed
Metrics systems are, by definition, a dynamic system with variance in data coming in, and variance in data being read. No matter how big or small that system is, it will get overloaded with writing metrics or reading them with queries. That means the system needs safeguards to prevent an outage due to a large write volume or a heavy read query.
A common issue is too much incoming metrics data flooding the system. By rate limiting the amount of data when contention occurs, the observability team can, at the cost of a single engineering team that’s emitting too much data, keep the platform alive despite being bombarded with too many incoming metrics streams.
By visualizing and reporting back the rate at which teams stream data into the metrics platform, they become aware of their (relative) share of the system’s resources, and allows them to track relative changes over time as they add metrics and tags and experiment and optimize. Observability teams can use this data to put limits in place to limit the number of metrics or labels each team is allowed.
On the query side of things, query limitations help to prevent a single user from overloading the entire system with a slow or computationally expensive query (which can sometimes be caused by excessive dashboard loading by a group of engineers). A lot of this has to do with training, expertise, and optimization (in which the observability team plays a big role; see the aforementioned blog post).
Aggregation also plays an important role. It is one of the most effective ways of reducing the cost of a query, by reducing the amount of data a query has to sift through. This is especially useful for queries that run as part of a dashboard and is run everytime the dashboard page is loaded or refreshed. Ad-hoc and dashboard queries are most likely to cause a sudden increase in query load, but note that in most systems automatic queries (such as for alerts, or recording rules) will likely be the largest source of the query load on the system.
Efficiently managing data through retention
After tweaking what comes in and how it’s queried, it also makes sense to look at how long metrics data is kept before discarding it. By lowering retention, we’re tweaking the total amount of metrics data kept in the system by discarding older data. As an intermediate step, data can be downsampled first, reducing the resolution of data as it ages.
By classifying and prioritizing data, teams can get a handle on what data is ephemeral and only needed for a relatively short amount of time (such as dev or staging environments, low-business-value services), and what data is important to keep for a longer period of time to refer back to as teams are triaging issues.
For production environments, keeping a long-term record, even at a lower resolution, is key to look at longer trends and being able to compare year-over-year. However, we don’t need all dimensions or even metrics for this long-term analysis.
Similarly, we don’t need to keep data for some kinds of environments, such as dev, test, or staging environments, services with low business value or non-customer facing, internal services. By choosing to limit retention for these, teams can balance their ability to query health and operational state, without overburdening the metrics platform.
Using resolution to optimize data
Reducing resolution, or downsampling, is a tactic to reduce the overall volume of data by reducing the sampling rate of data. This is a great strategy to apply, as the value of the resolution of metrics data diminishes as it ages. Very high resolution is only really needed for the most recent data, and it’s perfectly ok for older data to have a much lower resolution so it’s cheaper to store and faster to query. Note that not all metrics need to be collected at the same resolution, even for a single application or service the resolution can vary.
Downsampling can be done by reducing the rate at which metrics are emitted to the platform, or it can be done as it ages. This means that fresh data has the highest frequency, but more and more intermediate data points are removed from the data set as it ages.
By downsampling resolution as the metrics data ages, the amount of data that needs to be saved is reduced by orders of magnitude. Say we downsample data from 1 second to 1 minute, that is a 60x reduction of data we need to store. Additionally, it vastly improves query performance.
A solid downsampling strategy includes prioritizing what metrics data (per service, application or team) can be downsampled, and determining a staggering age strategy. Often, organizations adapt a week-month-year strategy to their exact needs, keeping high-resolution data for a week (or two), and stepping down resolution after a month (or two) and after a year, keeping a few years of data. With this strategy, teams retain the ability to do historical trend analysis with week-over-week, month-over-month and year-over-year.
Taming data growth with aggregation
A completely different form of downsampling, instead of throwing away intermediate data points, is to aggregate individual data points into new summarized data points. This reduces the amount of data that needs to be processed and stored, lowering storage cost and improving query performance for larger, older data sets.
Aggregation is a great way for teams to emit and query highly dimensional, high-cardinality data from their services, and then adjust it based on the value it provides as it ages.
Aggregation reads the raw data, and builds a new, collated view based on the rules and query. Because teams often don’t need to view metrics across all dimensions, a simplified, aggregate view (for instance, without a per-pod or per-label level) is good enough to understand how your system is performing at a high level. So instead of querying tens of thousands of time series across all pods and labels, we can make do with querying the aggregate view with only a few hundred time series.
Aggregation is a way to roll up data into a more summarized but less-dimensional state, creating a specific view of metrics and dimensions that are important. The underlying raw metrics data can be kept for other use cases, or it can be discarded to save on storage space and to reduce cardinality of data if there is no use for the raw unaggregated data.
If you want to dive deeper into practical approaches, Chapter 4 of the O’Reilly Report on Cloud Native Monitoring goes into a great level of detail.
Reducing cardinality
Finally, a key aspect to consider when keeping the metrics system’s lights on, is cardinality. Cardinality is what causes teams to suddenly emit multiplicatively more data, when only adding a single label to a metric.
The simplest way of managing the explosion of observability data is by reducing what dimensions you collect for metrics. By setting standards on what types of labels are collected as part of a metric, some of the cardinality can be farmed out to a log or a trace, which are much less affected by the high cardinality problem.
This is a strategy that limits what is ingested, limiting the amount of data sent to the metrics platform. This can be a good strategy when teams and applications are emitting metrics data that is not relevant, reducing cardinality before it becomes a problem.
If you want to know more about reducing high cardinality, this whitepaper is a great place to start.
Wrapping Up
In this blog post, we talked about a few of the strategies observability teams can employ to keep the lights on.
Observability moves where the business and technical priorities are. As the business evolves, and the technological landscape evolves, what we measure and monitor changes as well. To be successful, platform and development teams need to recognize, and stay on top of, growing pains, bottlenecks caused by (the removal of) technical debt, market conditions, seasonality, changing business priorities, or other factors.


