")


With the transition from monolith to cloud-native environments, we are seeing an ongoing explosion of metrics data in terms of both volume and cardinality. This is because microservices and containerized applications generate metrics data an order of magnitude more than legacy environments. To achieve good observability in a cloud-native system, you will need to deal with large-scale data and take steps to understand and control cardinality.
This blog explains what high cardinality in observability is, why high cardinality is a problem, and explains three ways to tame data growth and cardinality.
What is high cardinality?
Cardinality is the number of possible groupings depending on the dimensions the metrics have. Dimensions are the different properties of your data.
What does high cardinality mean?
When we talk about metric cardinality, we mean the number of unique time series that are produced by a combination of metric names and their associated labels [dimensions]. The total number of combinations with data that exist are cardinalities. The more combinations there are, the greater a metric’s cardinality is.
Why is high cardinality a problem?
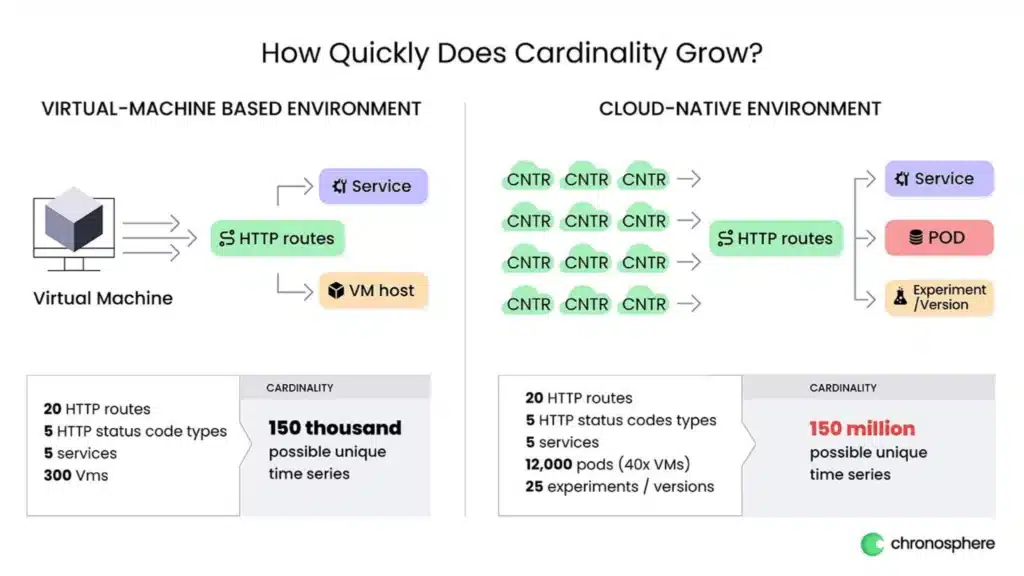
To get a sense of how quickly high cardinality explodes the scale of telemetry data, compare a legacy environment to a cloud-native environment and watch how quickly you end up going from 150,000 possible unique time series to 150 million!
- In the legacy environment example: You are monitoring twenty HTTP endpoints with five HTTP status code types, five microservices, and 300 VMs, which translates to about 150,000 possible unique time series.
- In a modern cloud-native environment in which high cardinality is a problem: You are running typically in the range of 10-50x more than the amount of application instances and you are also likely running experiments or some other variable you’d like to monitor (e.g. server git revision, mobile, or web client version). When you start to add in variables in a modern cloud-native environment, the multiplications on this basic set of telemetry data start to dramatically increase. For instance, there could be a multiplier of 40x on the number of instance counts – a result of running in smaller pods in a Kubernetes cluster. Additionally, there could be a 25x multiplier on experiments or active client/server version combinations being monitored for the traffic of these containers … Voilà! You’ve achieved 150 million unique time series! (Read my blog, Monitoring and alerting at scale, for a technical discussion on high-cardinality, including more examples of exploding metrics data.)
Low vs high cardinality in metrics
You might be naturally inclined to ask at this point – what constitutes high cardinality for metrics? It turns out the answer here is somewhat relative. In the legacy environment we mentioned above, we saw that we could easily create a metric with 150,000 unique values, with individual dimensions having no more than a few hundred values. In comparison when looking at a cloud-native environment, it’s not unreasonable for us to see individual dimensions that have thousands of unique values (or more). As we saw, we were able to easily generate over 100 million unique series for a single metric!
There is a tradeoff that takes place when more dimensions are added to metrics and cardinality goes up. The more important question to ask ourselves becomes: Is there an acceptable ROI for the dimensions we add to our metrics and the value provided by the additional cardinality?
To strike a balance between value and cardinality, we can classify our metrics and the dimensions they have into categories to help us think about the inherent tradeoffs.
Solving the high cardinality problem in three steps
It’s understandable how metrics data growth gets out of hand. There’s a lot of power in the extra level of granularity you get with the expansion of unique time series you’re storing.
The key is understanding how high cardinality impacts the scale of the telemetry data you need to collect and finding ways to control metrics data. Here are three ways to solve the high cardinality problem:
1) Reduce tensions between too much and not enough information
- Remember that “more data” is not “better”. The amount of data you’re collecting is not indicative of how well you’re performing monitoring or observability. Rather, the goal of the observability function should be to create a set of good telemetry data that lets you understand the system and mitigate problems at an effective level of granularity as needed by your organization.
- Define best practices for your team. Having the correct level of granularity on labels matters when it comes to common libraries that your company uses. This means creating best practices and an internal framework on how and which metrics will use tags or labels.
- Finding ways to control data flow. When people go well above what their usage pattern is, you want to be able to clamp down in an emergency situation so that their flood of telemetry data doesn’t impact others. This means setting up alerts (e.g. rate and query limiters) to create accountability and visibility. Once those are in place, make sure you can take action as necessary when a violation that needs immediate action occurs.
2) Don’t manage high cardinality metrics at a micro level
- Monitor the monitor. Create metadata dashboards for macro-level views of your monitoring system itself to look for things such as how many unique time series you’re tracking, how many samples per second you collect, or what’s your overall storage being used.
- Only deep dive when necessary. Alert on your own uptime, your own availability, and your own performance of your telemetry platform.
- Take a programmatic approach to taming cardinality. Utilize your observability platform’s aggregation functionality, such as aggregated roll-up views of telemetry data across entire categories of logs and metrics.
eBook: Comparing Modern Observability vs APM Monitoring
Learn why your observability solution needs to be optimizez for containerized infrastructure and applications.
3) Make observability a team effort
Monitoring and observability enable your company to operate without massive outages or huge levels of impact when you do have an outage. Your high-level of reliability is the thing that keeps your system dependable, and it’s the reason why people keep using your service. To achieve great observability, keep these three approaches to controlling high cardinality data in mind.
- Set company- or team-wide parameters. Put the onus on respective teams to reduce high cardinality metrics data by accepting and following parameters set by the observability team.
- Get buy-in from leadership. Establish with the leadership that observability is a core competency that drives business to your company and builds brand excellence.
- Don’t build if you don’t have to! Find open-source projects or vendors that let you get started ASAP so you can focus on the collection of telemetry and the effective use of it for your organization. You should primarily be driving the improvement of easily analyzing application and system behavior, which in turn improves time to remediation and higher operational excellence.
- Encourage safe experimentation and iteration of tools and processes. Make sure you have a second set of telemetry data that can be used for mirroring telemetry data from production and experiments. This will enable upgrades and changes to your pipeline without impacting your organization’s visibility into production workloads.
Chronosphere controls high cardinality & metrics growth
Chronosphere’s observability platform is the only purpose-built SaaS solution for scaling cloud-native environments. Chronosphere puts you back in control by taming rampant metric data growth and the high cardinality problem. Chronosphere allows customers to keep pace with the massive amounts of monitoring data generated by microservices, and it does so with more cost efficiency than legacy solutions, with tools like the Control Plane.
Get started with a customized walkthrough!
John Potocny contributed to this article.
Whitepaper: Balancing Cardinality and Cost
Learn how to control costs while managing high-cardinality data in your observability strategy


