
Cloud economics and observability
At this point, most people are probably familiar with the concern of observability costs growing faster than infrastructure costs. We’ve seen a number of reports within the industry that highlight the challenge companies face in realizing a positive ROI from adopting new tools to help monitor their complex environments.
This certainly places a burden on organizations as they struggle to balance the pace of innovation against maintaining a sustainable business model, all within the context of general market uncertainty. Is there anything that you can do to make things better, though? In fact, there’s probably a lot we can do in fact to better control how quickly our observability costs grow relative to infrastructure.
If you’re looking to tackle this problem in your organization, the first step is leveling up how we think about observability costs.
Let’s start with a scenario: It’s time for annual budgeting, and your boss asks you to generate a report on your infrastructure spend broken down according to major services that run your business for each quarter over the past year.
This probably isn’t too big of a request; if you tag resources in your cloud provider appropriately, it’s often straightforward to extract this information from the cost/billing tools major cloud providers include, and there are also several third-party tools, services and consulting groups available that can help you access these details and understand/optimize your spend.
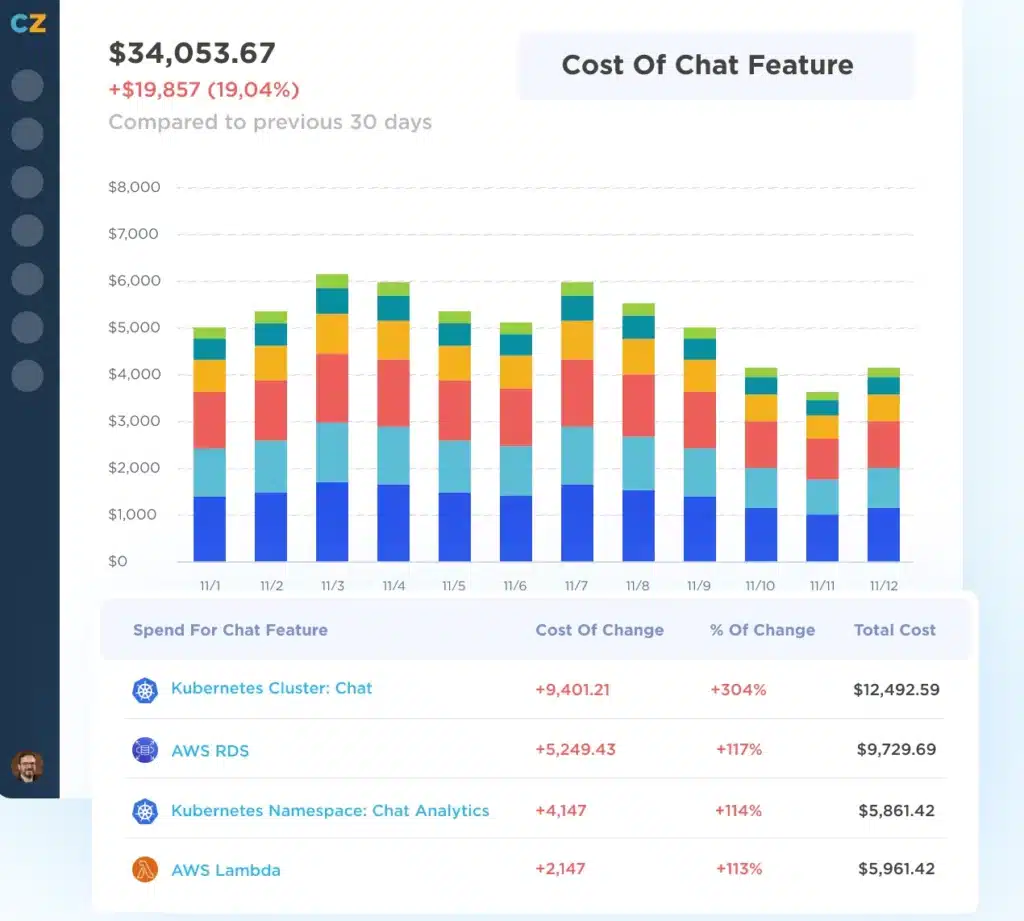
Now, what if your boss came back to you and asked if you can get the same cost breakdown for your observability spend? Is it even possible to do? Assuming it is, it almost certainly won’t be easy, but why is that the case?
Unfortunately, legacy monitoring solutions will offer little more than a high-level, point-in-time assessment of your usage without any flexibility to break it down by service or team or provide insight into trends over time. Open source systems aren’t very different in this case.
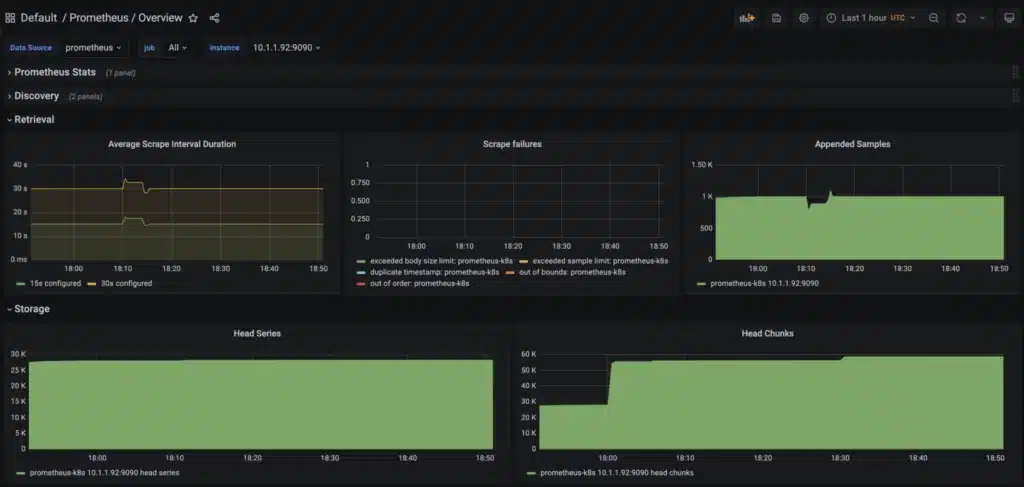
Even with open source solutions such as Prometheus we run into similar limitations. It’s easy enough to measure how much data we are ingesting, but the data available to us is similarly coarse and makes any kind of detailed analysis difficult to impossible.
You may have seen the term “cloud economics” when talking about managing cloud costs/ROI, but when we look at observability, there is far less in the way of guidelines and tooling to help us manage costs and maximize ROI. If our observability costs are growing out of control, can we perhaps take some of the lessons we’ve learned trying to bring cloud costs under control?
If we look at the rate of growth in observability costs, it certainly seems like a good time to start talking about the overall economics and validating a positive return on our investments.
Understanding our observability ROI
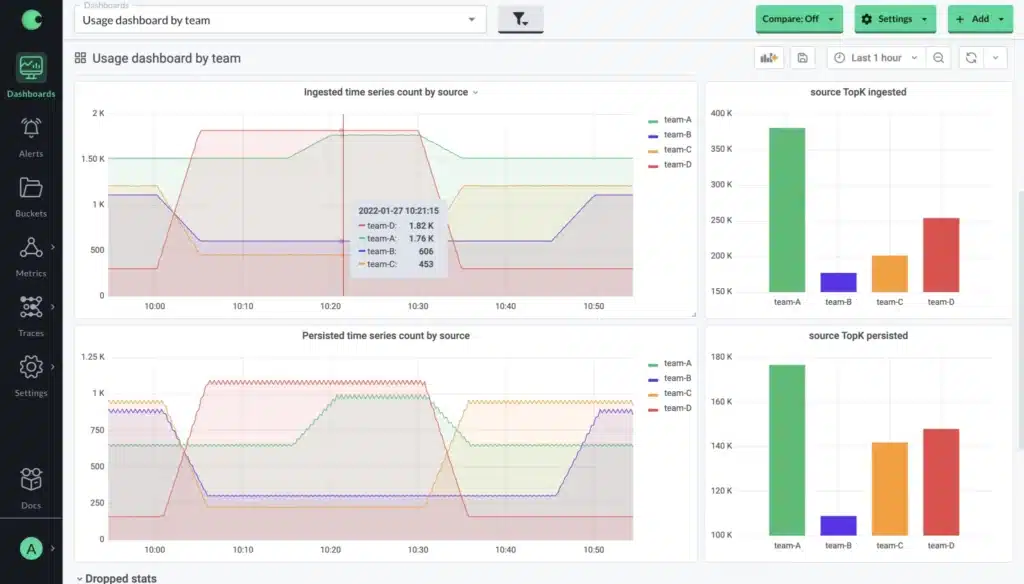
We need to be able to understand the return we’re seeing on our investments in observability. You may have some notion/framework for measuring the benefits already, so to start, let’s focus on how to measure the costs in more detail. We can again draw some parallels from how to think about managing cloud spend. The first thing to understand is that granularity is key to deriving insights, and that means having tags in place that allow us to associate the data we collect with the services that we run or the teams that manage them.
There’s a handful of questions we should be able to answer, ideally for each type of data we collect (metrics, traces, logs, etc.):
- What portion of my spend does each service/team account for?
- What are the top sources of spend overall? For instance, what are the top 20 most expensive metrics that I am collecting?
- How does the volume of data that I collect change on a daily/weekly/monthly basis? For example, are there significant variations throughout the day? If so, what services/teams are generating them?
- What is the rate of my data growth vs. infrastructure growth? And how are different teams contributing to it?
We also want to make sure that we are making use of the data we are collecting. This is something you want to delegate to individual teams/service owners so they have autonomy over what they collect (provided they don’t exceed their budget), but it is generally useful to be able to answer some questions related to how your data is being consumed. For example:
- For my most expensive metrics, in what dashboards/alerts are they being used?
- Are we making use of all of the cardinality we are collecting or are there dimensions that are consistently aggregated away at query time?
As we track the answers to these questions, we can start to take a critical look at the data we are collecting, and map it back to the value that it provides. For example, high-cardinality metrics that are seldom/never used can be eliminated or aggregated to reduce the overall cost of the data being collected. Over time, this should lead to more reasonable observability costs as we optimize the data we collect to more closely match the value we get from consuming it. Additionally, teams/service owners can have more confidence around adding more instrumentation/collecting more data where it is sensible to do so since they will have the data to prove whether doing so is a good investment.
Make strategic decisions around your observability data
We’ve seen this pattern before with cloud infrastructure: Observability costs will continue to run rampant until the necessary steps are taken to understand where the spend is coming from and where it isn’t paying for itself.
If observability costs are a current focus for your company, start by seeing what you can measure right now. From there, you can build a plan to improve the visibility you have into your costs, whether through building custom reports or by adopting new tools that provide the insights you need. Not every service/team will have a massive disparity between the amount of data collected and the value derived from it, but understanding the current state is the first step to making more strategic decisions around our observability data.
This problem has gotten big enough that it needs to be a first-class concern when choosing any monitoring/observability solution, and here at Chronosphere, we’ve made it a focus of our offering to give customers the visibility and control they need to take back control of their observability costs.