")

What is a cardinality storm?
Cardinality tells us how many unique time series we are storing and tracking.
Read more about Classifying types of metric cardinality.
Increases in metric cardinality can be caused by a number of factors as outlined in the previously mentioned blog post. The important bit is, that it will cause a plethora of potential issues, including a decrease in performance of your observability tooling, potential outage of your alerts and dashboards, facing overages for your observability tooling, and more.
This gets even more prevalent when deploying workloads in highly scalable environments like container orchestration solutions (Kubernetes, ECS, etc) and running microservices. In comparison to a monolithic architecture, this scaled out environment has a much higher metric cardinality and even small changes can greatly amplify it when collecting metrics for all of your containers and services (which you generally want to do to maintain good visibility into the operation of the system as a whole). The result can be a so-called cardinality storm—a metric cardinality explosion — that can have serious consequences mentioned above.
What should you do when observability metric data skyrockets?
First of all, detecting that metric data is exploding is quite difficult in most situations. Tools used to manage observability data don’t always have great ways of detecting that cardinality is increasing. You actually might detect it by observing some worst-case scenarios including impacts on the performance or availability of your alerting and dashboarding (effectively removing visibility into the performance of the monitored system). In general, teams managing observability tooling react to these situations by either rolling back code changes that might have introduced it or stopping the collection of data for certain endpoints (essentially managing the producer side).
Both of these are slow and cumbersome, to say the least, and if a small mistake is made, it could have dire consequences on the visibility of the performance of the application and the infrastructure as a whole.
With Chronosphere, you have the ability to detect (alert, view) the volume of the data segmented per arbitrary labels in real-time. It is also important to keep in mind that Chronosphere’s observability platform was developed out of necessity for “cloud scale” and does handle spikes in data volume and cardinality really well. However, having the ability to understand what exactly is sent into it is extremely useful.
That’s where the Chronosphere Profiler becomes invaluable.
Chronosphere Metrics Profiler: How we can help
The Chronosphere metric profiler enables you to analyze the data live while it’s ingested into the platform. That means seeing the volume and cardinality of the metrics as they’re sent into the Chronosphere observability platform.
If you, as an administrator, get notified that a volume of data for a service, team, application, product, feature, etc, is going past a level deemed unacceptable, you can easily jump into the profiler and find the dimensionality causing the increased volume of data.
Here’s an example of the profiler configured to:
- Filter the incoming data from job =’cadvisor’, that has the label ‘image’ and without ‘image’ matching ‘*pause*’
- The results are grouped by the metric name and the value of the label image
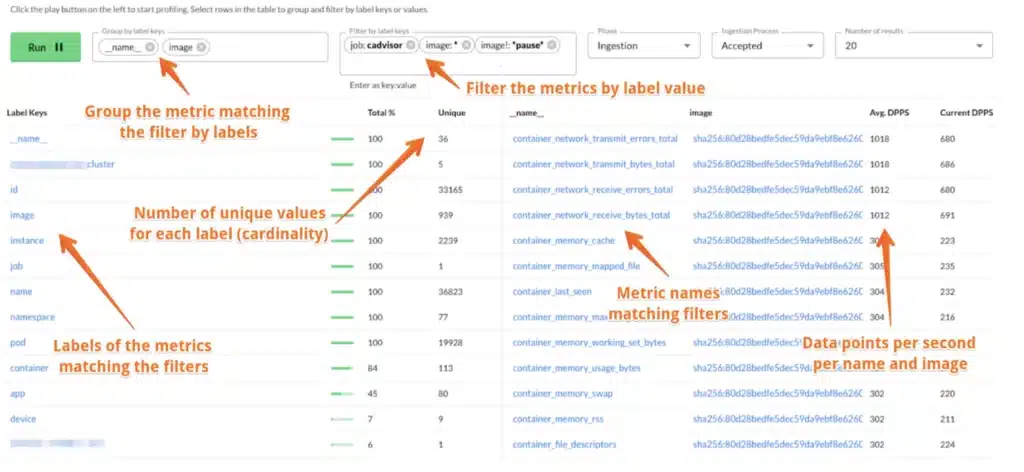
This enables you to understand the volume and cardinality of the live, incoming data in seconds. If you’re analyzing how data from a specific source is shaped, this immediately provides an answer.
In the context of a metric cardinality explosion, this uncovers what specific part of the metric data actually is the culprit (potentially a single service, environment, …) and that gives you a great starting point to implement controls within the Chronosphere product that address it (as described by my colleague in his recent blog post, How Chronosphere’s control plane helps users manage metrics at scale.
In the case of a cardinality explosion (which is often caused by leaking high cardinality data into a label), temporarily implement a selective drop policy that will remove the data on ingest.
As an example, if you identify a label with relatively high cardinality (image, name, or id tend to be the common culprits when talking about cadvisor metrics) and that dimension is not used in dashboards and alerts, implementing a roll-up rule can potentially reduce the data volume by as much as the cardinality of the label without impacting the end-user access to the data they require.
We’ve recently enhanced the Chronosphere profiler to not only enable you to analyze the data as it enters the control plane. but also when it is being persisted. This way it is easy to understand if the aggregation rules (also referred to as roll-up rules) you put in place have the desired effect on the data stored on the platform.
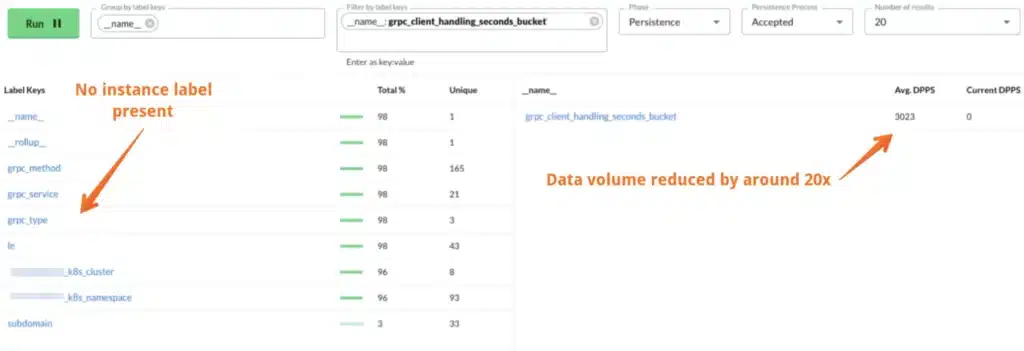
Here’s an example of raw data being ingested in the first image, and the data as it is persisted into the database in the second image. Between ingestion and persist is when the roll-up rules removing the instance label take effect.
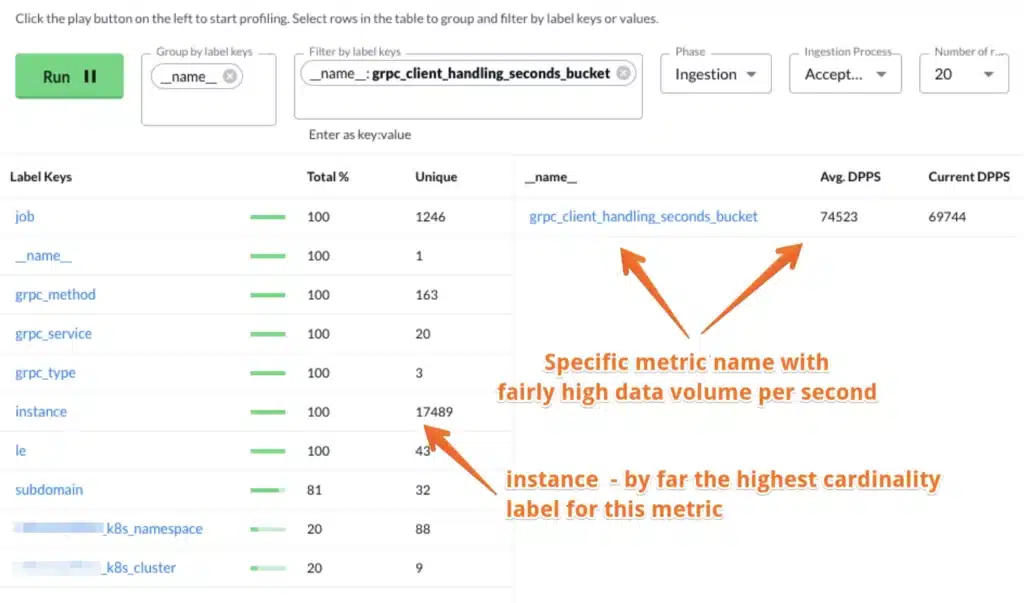
Notice how the persisted data volume in the image below is much lower volume (about 20x) and doesn’t have the “instance” label anymore. Which in this case makes a lot of sense as we probably want to see handling time on a per “grpc_service” or “grpc_method” level, not on a per single instance.
Why is analyzing live metric data so powerful?
Looking back at what we covered so far, it’s clear that the Chronosphere Profiler gives us some unique insights into live metric data that have been difficult to get to in the past.
It’s also important to consider the implications of not having a tool like Chronosphere Profiler when events like exploding cardinality data inevitably occur. Here are a few major ones:
- Loss of visibility caused by overwhelmed tooling or un-queryable data caused by volume
- Incurring overages in your metric provider of choice (not true for Chronosphere)
- Fire drills to roll back
- Reduced MTTD and MTTR due to lack of tooling/ability to detect
- Impact on business growth due to complications with effectively scaling infrastructure and applications while maintaining visibility into the operation of both
Chronosphere enables you to maintain control of the volume and cost while maintaining visibility of your infrastructure and application metric data in a rapidly changing environment. If you’re experiencing similar challenges we’d love to hear from you and see how we can help out!


