
Root cause analysis needs just the right amount of data
Modern distributed tracing tools don’t do their intended job – root cause analysis – as well or easily as desired. But at Chronosphere, we’re looking to make root cause analysis more accessible with the new capability to ingest and analyze distributed trace data at scale economically with our observability platform. You can read our preview blog post from last year for a bit more depth on the challenges we’ve seen in the market with existing tracing tools.
No one knows your systems and applications better than you do. So why would you rely on a vendor to determine the amount and types of tracing data you see to perform root cause analysis? For example, a vendor’s default setup could be sampling data or not to handle high levels of ingestion.
But why is this bad? A vendor doesn’t know the ins and outs of your systems, and could be collecting data in a way that gives an inaccurate picture. Chronosphere empowers you to determine the right checks and balances for your company – like what interval is data collected, what data is useful for you, how much data is collected, how long is it retained, etc. – so you can trust your data. Similarly to Chronosphere’s approach to metric data, you control the volume of distributed trace data collected, so you can focus your data spending on what you need vs what you don’t.
Query to look at all the traces, not just the spans
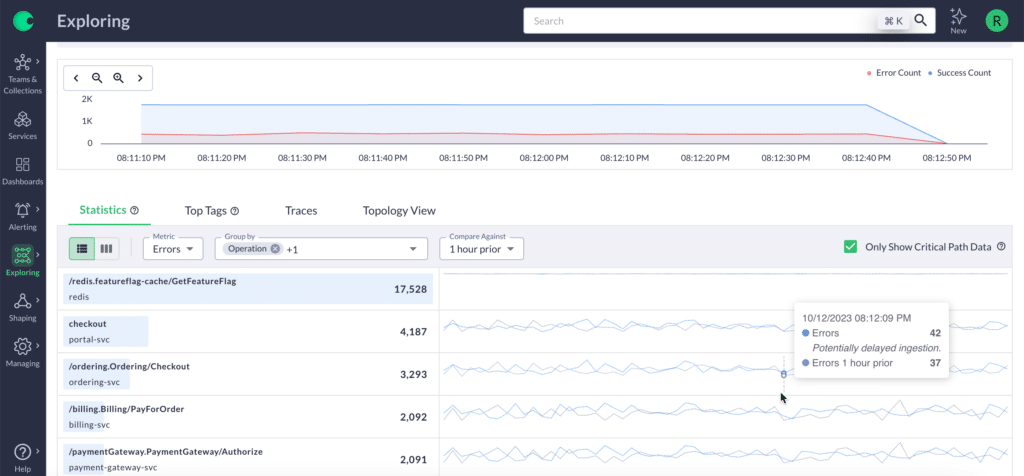
You shouldn’t be limited to just reviewing one set of trace data at a time, but all the trace data relevant to the issue you’re working on. One of the unique capabilities Chronosphere offers is that we provide intelligent aggregation and analysis that enables you to compare two sets of traces rather than individual spans. As a result, you no longer have to constantly switch between individual spans and remember the details, instead you can look at them side by side. It allows you to quickly answer questions such as “How was this span working five days ago vs today?”
Making silos disappear by making data and analysis accessible to everyone
If an experienced team member started today at your company, would they be able to start using your tools right away? Probably not. But at Chronosphere we think everyone should be empowered from day one to succeed by making it easier to provide a broader and deeper understanding of root cause by seeing how trace data complements metric data with out of the box integrations of dashboards and alerts.
With these dashboards and alerts at your fingertips, power users and casual users can get answers quickly without having to page someone else to assist. Take it a step further by templating some of your most frequent or complex queries so others can do faster root cause analysis without the assistance of advanced users.
Future-proof Observability
Metrics continues to be a leading component in observability practices, but as systems have become more distributed, the need for tracing has become more apparent. So too has a different way to approach it. At Chronosphere, we’re looking to future-proof observability as trace data becomes more available through standards like OpenTelemetry collector. You shouldn’t need a separate tool to perform tracing, but rather a platform that can collect all your metric and trace data and give you the insights you need without frequent context switching.
Interested in learning more?


