")


As the Prometheus documentation says, recording rules allow you to precompute frequently needed or computationally expensive expressions and save their result as a new set of time series. Recording rules are the go-to approach for speeding up the performance of queries that take too long to return, and they are also commonly used to alias complex or repetitive PromQL subexpressions. While recording rules can be quite useful and are almost certainly in use in any production environment, they do have some downsides as well. In this post, we’ll take a look at how recording rules work, and discuss some of the pain points that you are likely to encounter when your workload scales up.
How Prometheus recording rules work
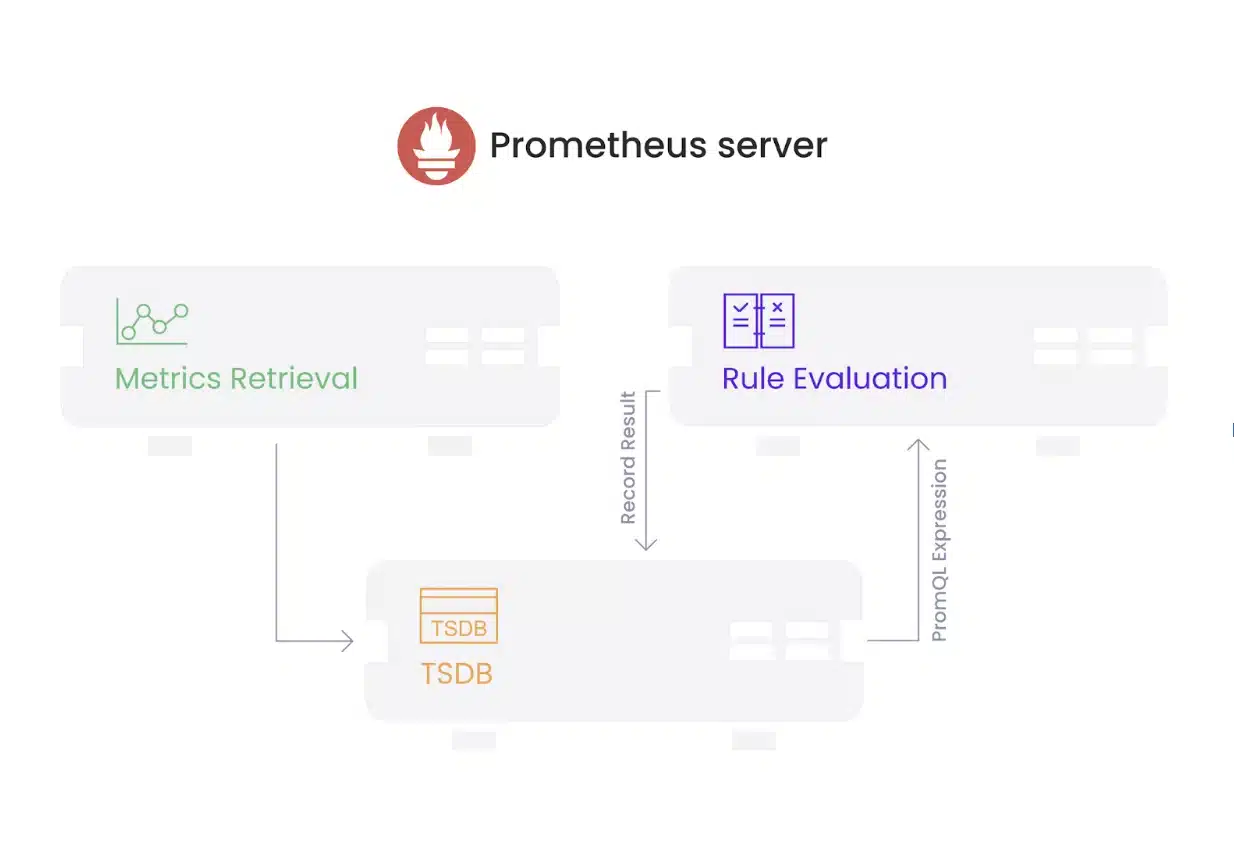
So, how do recording rules work? Recording rules are defined in YAML files that are referenced by the rule_files option in the Prometheus configuration file. Rules are structured into named groups, with each group having the ability to set the evaluation interval (default is 60s, as specified by the evaluation_interval option in the Prometheus configuration file), and an optional limit on the number of series that can be generated by the rules in the group. As part of the Prometheus server’s regular operation, it evaluates the provided rules on a schedule according to the configured evaluation interval for each group.
Here’s an example recording rule group, to help illustrate:
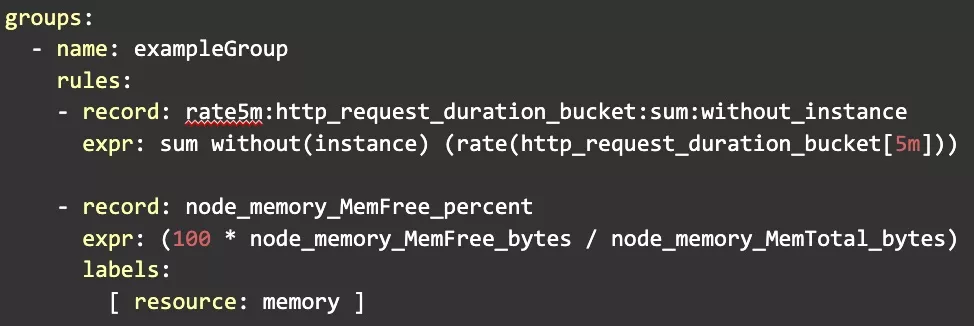
The above defines a group of two recording rules, with each rule having two required fields – expr, which specifies the PromQL query to evaluate, and record, which specifies the name of a new series to store the result of the expression under. Looking at our example rule group, you can see one instance of a recording rule that can be used to optimize a slow query(by performing an aggregation statement and excluding certain labels), as well to alias an expression, such as calculating the free memory reported by the Prometheus node_exporter as a percentage.
These are fairly straightforward examples, but they hopefully highlight how easy it is to define a new recording rule. This is an important benefit – as a developer, I can easily take a query that is taking too long to return in a dashboard, and speed it up by creating a new metric that gives me the result directly!
Let’s quickly summarize the benefits that Recording rules give us:
- Because they are defined using PromQL, it’s very easy to create a new recording rule – there’s almost no learning curve.
- Additionally, the expressiveness that PromQL gives us combined with recording rules allows us to create synthetic metrics to represent what would otherwise be very complex queries.
- The whole process is self-contained within Prometheus (no external dependencies), which means users can leverage recording rules without setting up any additional components. This follows the general spirit of the project as a self-contained solution that can be deployed as a single executable.
Where recording rules fall short
Now that we’ve gone over how rules are defined and summarized the benefits they provide, let’s talk about their drawbacks. As in most systems, recording rules start to cause problems at scale, and in a production cloud-native environment scale can come quite quickly. As the volume of metrics we ingest and analyze grows, our usage of recording rules will likewise increase, and the likelihood of encountering the pitfalls we’ll cover does as well.
The potential for rule sprawl
The first problem is a reflection of how recording rules are defined. We noted above that because rules are simply PromQL expressions to evaluate, they are easy to define and can also be quite expressive. This comes with a tradeoff though – every query can easily be converted to a recording rule, but each query likewise needs to have its own rule. The consequence here is that you may end up copy/pasting several rules and making small variations to the expression being evaluated, so that we can cover a variety of cases.
Here’s a concrete example of this problem – say you have a dashboard we want to optimize with recording rules, as shown below:
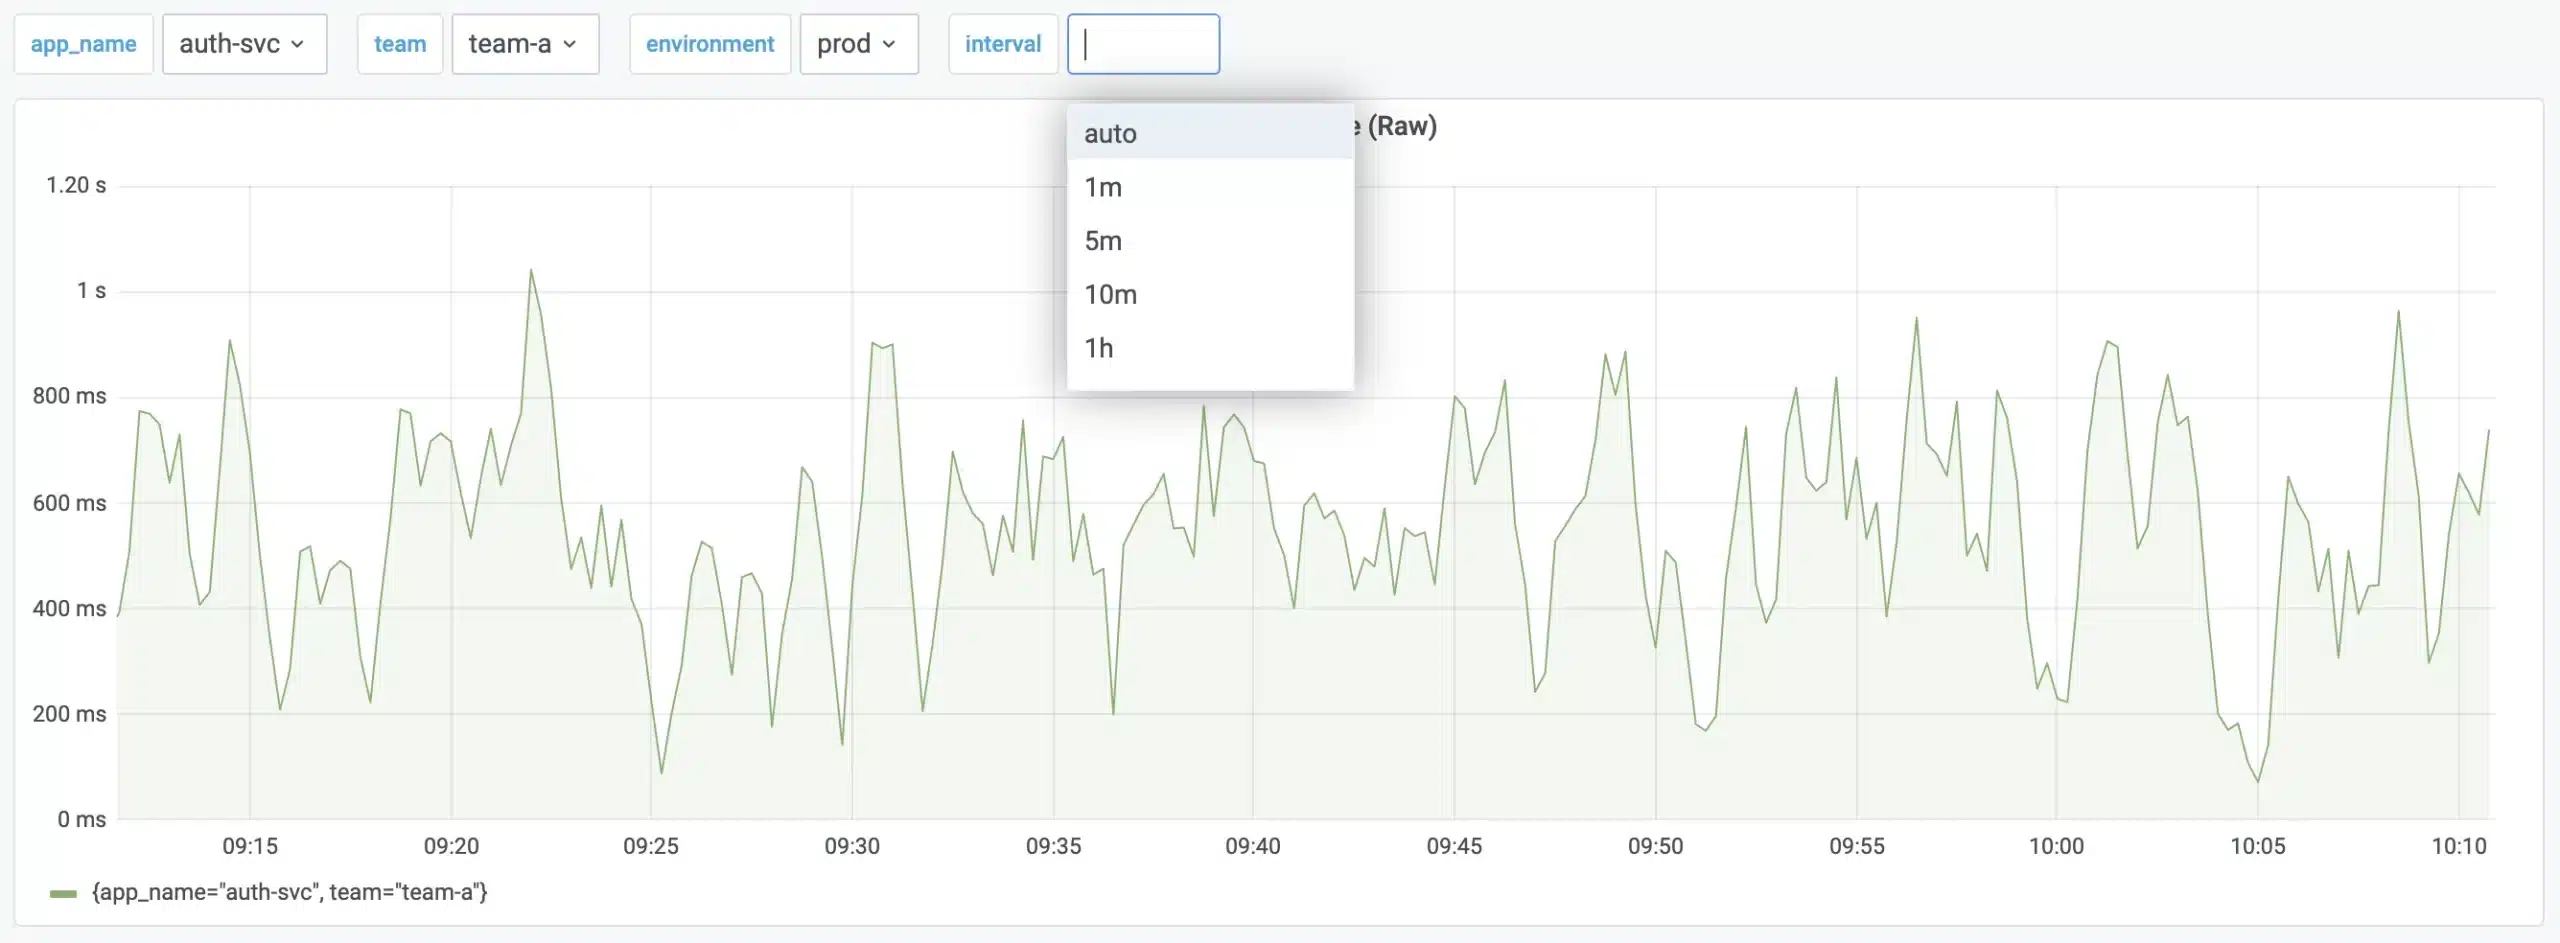
The query powering the above graph might look like this:
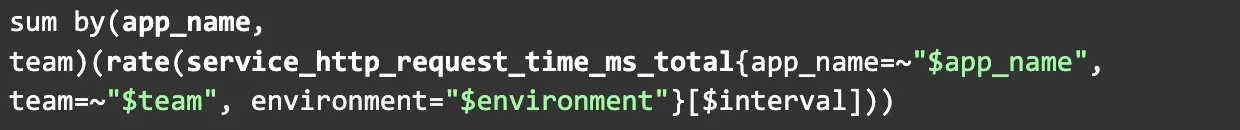
There are a couple of label filters in this query that are mapped to variables – we can easily omit them from our recording rule expression since we’d probably want to apply the rule to every value for app_name, team, and environment. What about the variable for the rate function though? To cover all of the potential range vector selectors that can be applied, we’ll need to create a copy of our resulting rule for each possible option. This is not ideal – now we’re mapping what we tend to think of as a single query to N recording rules that run on the server, with each interval we add generating an additional rule (and more overhead on the server). Note that having multiple variations of the same rule like this is not just a configuration management problem. Because every rule we define is getting written back to the TSDB as a new metric, it also translates to a greater cognitive burden for users – if I’m going to get the benefit of my rules, I need to not only know that they are available as an alternative to the raw data, but I also need to know which recorded metric to use. The more similar-looking rules I have, the harder this will become.
Note that having multiple variations of the same rule like this is not just a configuration management problem. Because every rule we define is getting written back to the TSDB as a new metric, it also translates to a greater cognitive burden for users – if I’m going to get the benefit of my rules, I need to not only know that they are available as an alternative to the raw data, but I also need to know which recorded metric to use. The more similar-looking rules I have, the harder this will become.
The potential for rule sprawl is certainly a notable problem on its own – it’s quite common to see production environments with hundreds of recording rules, and some larger environments that maintain well into the thousands of rules. This potential for lots of rules with little variations also ties into another issue that we can encounter, which comes when we need to make changes to our rules…
Changes, backfills, and inconsistencies
To briefly reiterate another important aspect of how recording rules work – in effect, each rule group defines a background process that executes a set of expressions, and stores the result as a new metric in the server. There are a few consequences around this model that can be points of friction, particularly when you are managing larger volumes of rules at greater scales:
- New rules only apply moving forward by default. When we create a recording rule, there’s no automatic process to backfill the result of a rule when it is created. This is possible to do using the promtool command-line utility, but it does have some caveats, and backfilling a large number of rules or a long historical time range will understandably be an expensive operation for a production system. This is particularly problematic if you have a recording rule that you want to create to optimize looking at a query over a long historical time range; we either have to do an expensive manual backfill to get what we want, or accept that we’ll have to wait for the rule to generate enough history to give us the insights we want moving forward.
- Updating the definition of an existing rule has the same effect as if you change the meaning of the underlying metric it relies on – there is a disconnect created between the historical data and the result going forward. There are tricks we can use to mitigate this problem, such as renaming the metric for a rule each time you modify it or including a label such as the version of the expression. Again though, these measures have their drawbacks and require end-users to be aware of them when interacting with the data. This issue in particular may be an issue when using recording rules to alias expressions – you don’t necessarily want the new definition to only apply going forward, but that’s how it will work as a result of the alias being expressed as a separate metric.
- There’s the potential for inconsistency if the metrics our rules rely on arrive late from a subset of targets. This could happen because scraping one or more of our targets takes longer than usual, and the probability of this being an issue increases with the number of targets we have. Introducing remote storage solutions such as Thanos/Cortex can also raise the likelihood that you see this problem since it adds the variability of latency sending data via remote-write. The net effect here is that viewing the result of a recording rule may not be as accurate as if you query the underlying raw data directly. This may not be an issue in practice, but it adds an extra layer of uncertainty if you are looking at a chart powered by recording rules and see an unexpected dip/spike in the data.
The performance implications of Prometheus recording rules
Most of the issues we’ve discussed so far have been related to the management of recording rules, but what about the performance implications that come with them? We noted that a major use-case for recording rules is to speed up otherwise slow/expensive queries by evaluating them in the background, so it’s reasonable to assume that there’s some overhead associated with that work. How much do we see in practice?
Let’s look at an example. If you use the kube-prometheus stack as a starting point for monitoring a Kubernetes cluster with Prometheus, it comes with 86 pre-defined recording rules. Below you can see what it looks like when I deploy the stack using the default configuration on a 1-node k8s cluster, and add the recording rules after a short time:
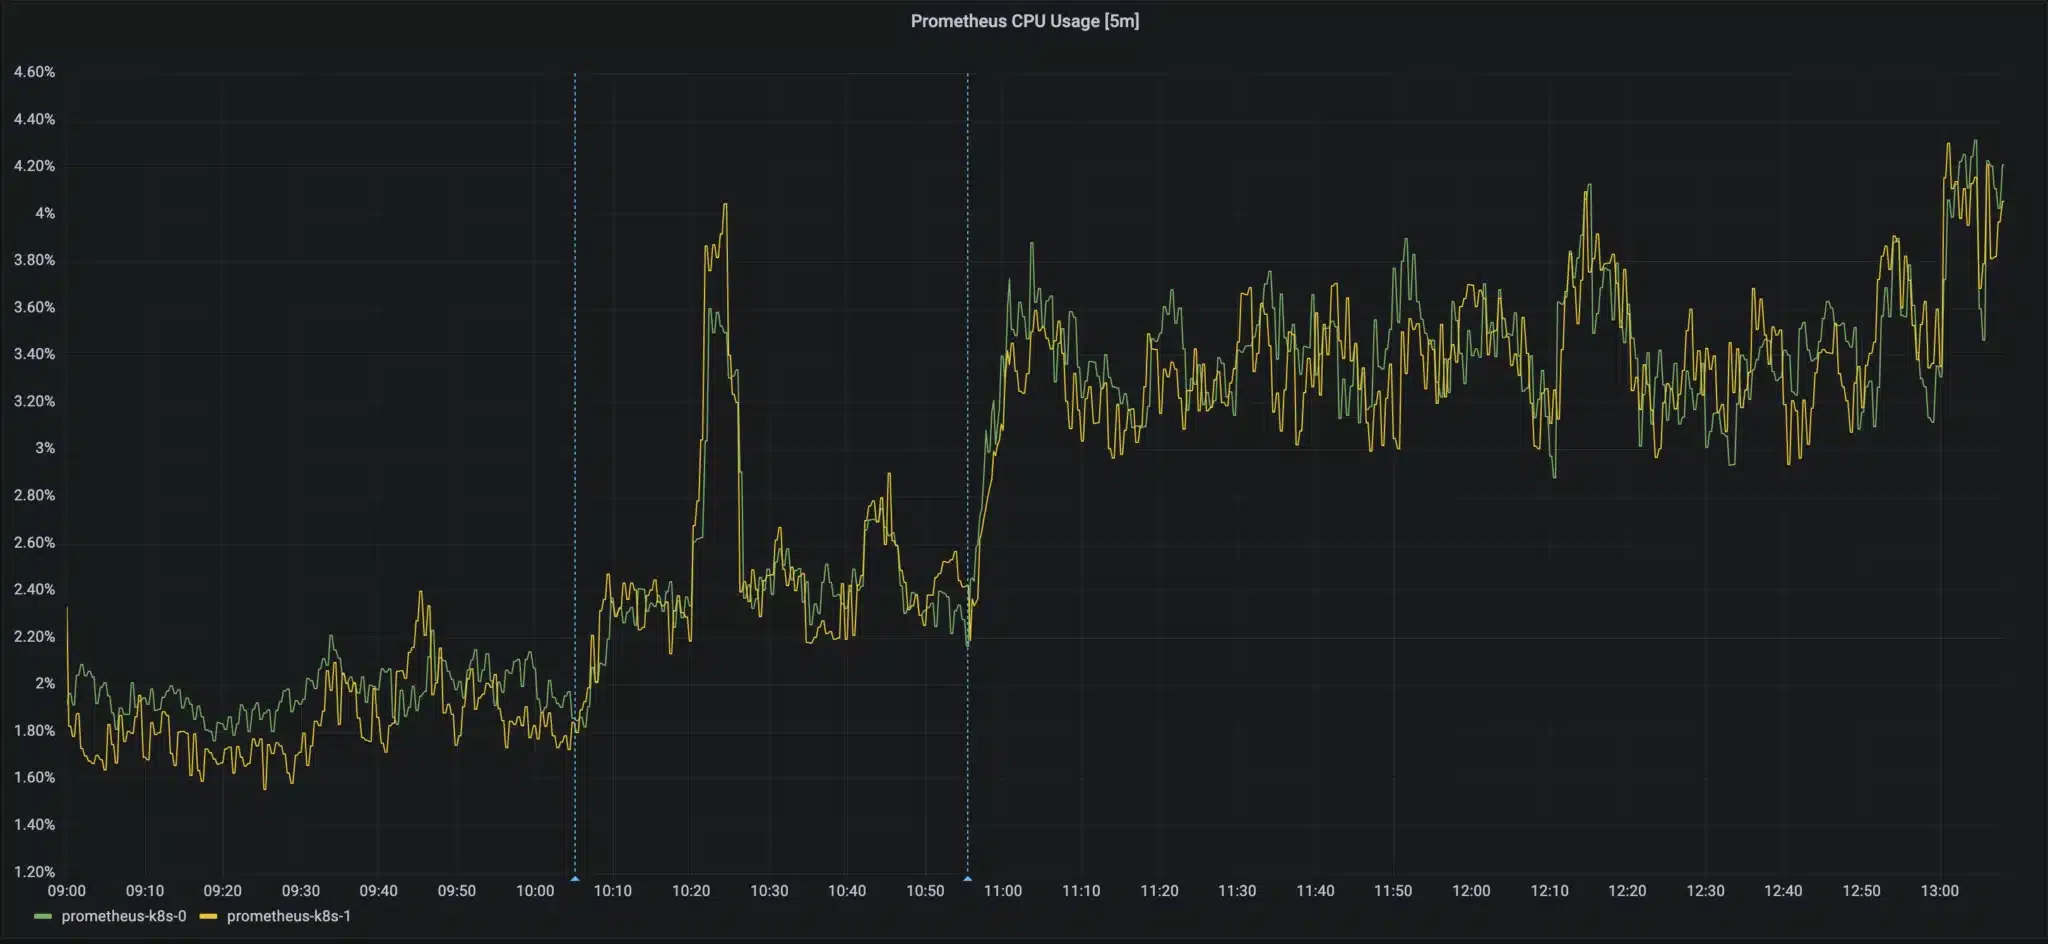
You can see above that the Prometheus server jumps from ~2.5% CPU utilization to ~3.5% once the recording rules are added. That’s a pretty big increase in CPU compared to our baseline! It could be argued that the absolute overhead we’re seeing here does not amount to much, and is certainly worth the benefits that we get from the rules that we’ve defined. There are a few things to highlight here though:
- We’re looking at a 1 node k8s cluster, and our Prometheus instance does not have much load as it is only scraping a handful of targets. That being said, we can expect the relative overhead of evaluating these rules for the set of metrics we’re ingesting to stay about the same as our k8s cluster has more nodes/pods added to it, since that will increase the number of series that the rules have to fetch when they run. Additionally, remember that we’re writing the results of each rule to a new metric, so we’re paying the cost of ingesting additional data for each rule, on top of the cost of executing the actual query.
- This is just the out-of-the-box recording rules for the kube-prometheus stack that we’re looking at; as we add more off-the-shelf applications (and our own services), we would expect the number of rules we have to grow pretty significantly as well. For example, if we were to use sloth.dev to generate SLOs for the services we run, it will create ~7 recording rules for every SLO we define. That will add up quickly, and can be even more expensive, say if a service typically runs on a lot of containers.
- In reality, the snapshot we’re looking at here does not even capture the full overhead of these rules! That’s because some of the rules have fairly long range-vector selectors – many just look over a 5m window, but others are looking at several hours, or even up to 30d. For us to see the impact of those rules, we’d need our Prometheus instance to have 30 days of historical data present (which it does not). This point is crucial when we consider the example we discussed for how rule sprawl can occur – rules with long range-vector selectors will end up reading much more data when they evaluate. As a consequence, they can be significantly more expensive on the system. In fact, for multi-day lookbacks it may be necessary to break a single rule up into multiple evaluations that each consider a subset of the total series, to ensure that the rule can complete the query within its evaluation interval – that means even more recording rules than before!
The overhead here most likely is necessary in order for us to interact with our metrics in a scalable manner, but the more significant issue at hand is that the cost of our recording rules is directly tied to the TSDB itself; we’re taking resources away from the same system that we use to ingest metrics or evaluate user queries, so we can’t scale them independently.
For Prometheus in particular, this is a big problem since it’s not easy to horizontally scale, but even for systems like Thanos and Cortex that are designed to be horizontally scalable, we end up with an architecture where costs grow much faster than you expect if you fail to account for the overhead of the recording rules you are creating.
When all you have is a hammer
Despite the drawbacks they have, recording rules really are a great feature for Prometheus, and they allow us to do a lot of things that would not be possible otherwise. For a system that prioritizes being easy to deploy and having an all-in-one solution, it’s a truly elegant solution to a variety of problems. At the end of the day, the real problem with recording rules in production systems is that it’s one of the only tools we have to solve the problems that we face, and hopefully, by now it’s clear why that doesn’t work as we scale the number of metrics we’re managing.
Ideally, we should have more options available to us than just recording rules to help with the problems that they are used to solve. If we draw a parallel to relational databases, recording rules are similar to a materialized view – they’re undoubtedly useful, but would you solve every problem in your database with materialized views, or would you also use features like indexes, stored procedures, and standard views as well? Each of these tools has its own set of benefits and tradeoffs, and a smart administrator knows how to blend them correctly to get the best possible outcomes for their use case.
Expanding options for managing Prometheus metrics
At Chronosphere, we’ve developed specialized capabilities to complement/replace the capabilities that recording rules provide. Organizations that migrate to Chronosphere can import their existing recording rules directly, and from there, our expert staff will work with your team to migrate your rules to use other capabilities (such as aggregation rules) where it makes sense. If you are struggling with managing your Prometheus workload today or are frustrated with the issues that Prometheus recording rules can cause at scale, reach out and let us know! We’d love to talk about how we can help.


