


A common motivation we hear from engineering organizations looking to migrate from Prometheus is around query performance. As the amount of metric data we collect increases, it’s only natural that consuming that data through dashboards and alerts will become more expensive. But what tools does Prometheus provide to help here? In this post, we’ll look at some of the visibility that Prometheus provides into its query workload, and the options we have to improve the performance of slow queries.
What determines query performance
Before we dive into the details here, let’s discuss what the biggest factors for query performance are. In general, when querying data the biggest factor in the overall performance (besides things like hardware constraints) is how much data we have to consider/process in order to generate our result. We’ve probably all experienced this in practice before – both simple and complex queries will return quite quickly when running against a small dataset, but as you scale up the amount of data we have the performance starts to degrade accordingly. For time-series databases like Prometheus, we can focus on two factors in particular that determine how much data a given query will consider:
- How many distinct series does a query have to process?
- How many data points does a query have to process?
Between these two, we typically care more about how many series are processed by a given query, although if your query is looking over a long time range the number of data points/samples starts to become important as well. That’s why it’s usually recommended to downsample metric data to a lower resolution when storing it for longer periods of time – besides the savings in storage this can provide, it also gives us a meaningful improvement in performance when we want to query over weeks or months of data at a time.
What kind of observability does Prometheus give us?
Now that we’ve looked at what determines the performance of Prometheus queries, let’s dive into the tools we have to help us identify whether there are queries that need to be optimized. First, if you have Prometheus configured to scrape itself, it does include some high-level metrics on the query workload, such as information on time spent executing user-issued queries vs. automatically executed rules, like recording or alerting rules. This helps us keep track of the general performance of our Prometheus queries, as well as do things like get alerted if a rule group is getting close to taking longer than its execution interval.
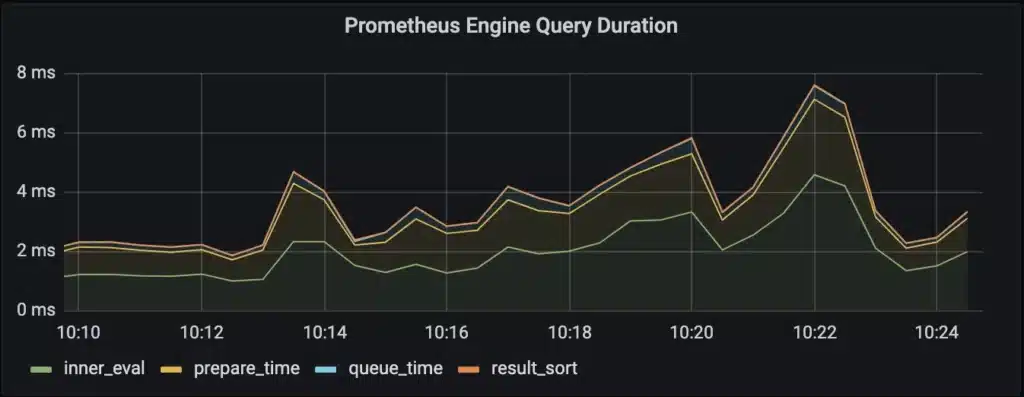
Note that queue_time is basically 0 in the picture above; this is what we normally expect, unless the server is seeing more simultaneous requests than allowed by the server’s query.max-concurrency flag.
What’s noticeably missing here, is any kind of information that will allow us to reason about the general efficiency of the queries being run against Prometheus. There aren’t any metrics that tell us how many series/data points are being fetched from the database vs. returned to the user – this presents us with a problem, since as we noted above, looking at how much data is being read vs returned is the best way to understand how expensive our queries are, relatively speaking. We can still use the metrics available to us to detect whether queries are slow, but there’s extra work involved to understand whether that is because they are fetching a lot of different series, fetching a lot of data points, or if there’s another issue such as a lack of resources available to Prometheus.
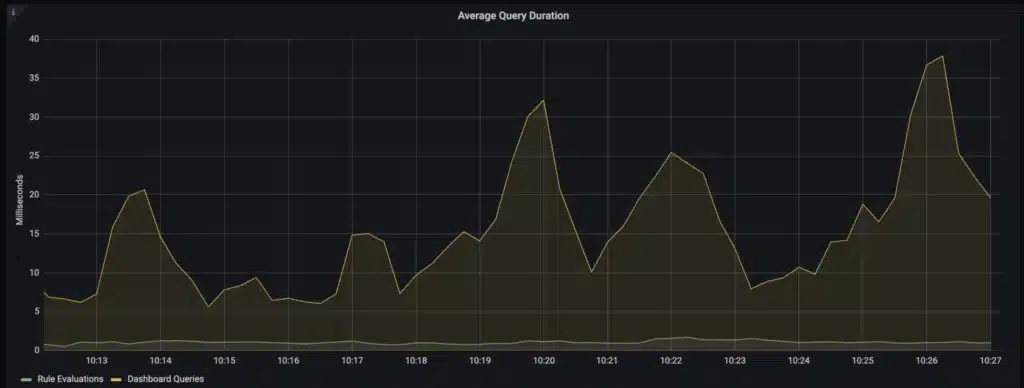
Besides understanding whether queries are efficient/performant in general, the other thing we want to understand is which queries are the most expensive in our workload. In terms of metrics available to us, we can see if Prometheus is spending more time on evaluating alerting and recording rule queries vs ad-hoc queries, and which rule groups are most expensive in the case of rule queries causing issues. What we don’t see here though, is the queries themselves – that would be too much cardinality for Prometheus to emit back into itself.
In order to get a sense of the performance of specific queries, we can enable the Prometheus query log, which will write a JSON object containing details about every query executed against the server to a specified log file. Here’s an example of the output:
{
    "params": {
        "end": "2020-02-08T14:59:50.368Z",
        "query": "up == 0",
        "start": "2020-02-08T13:59:50.368Z",
        "step": 5
    },
    "stats": {
        "timings": {
            "evalTotalTime": 0.000447452,
            "execQueueTime": 7.599e-06,
            "execTotalTime": 0.000461232,
            "innerEvalTime": 0.000427033,
            "queryPreparationTime": 1.4177e-05,
            "resultSortTime": 6.48e-07
        },
       "samples": {
           "totalQueryableSamples": 80,
           "peakSamples": 24
       }
    },
    "ts": "2020-02-08T14:59:50.387Z"
}
The “timings” information here tells us how long the given query spent in the various execution stages, similar to the metrics we saw above. Included as of Prometheus release v2.35, the “samples” statistics tells us the total samples fetched, along with the peak number of samples processed simultaneously during the query’s execution – this is in relation to the server’s query.max-samples flag, so values that are too high here tell us if the server’s limit needs to be increased (note that increasing this may also increase memory usage). In addition to the per-query statistics, the file will contain details of the HTTP client/endpoint that initiated the query, or the name of the rule group it is associated with in the case of alerting/recording rules.
This is useful information, but again there are some drawbacks to the solution:
- In a complex environment, it will be difficult to identify where a specific user-initiated query originates from. Ideally we would know details like the name of a dashboard that it is associated with, but unfortunately Prometheus can’t determine that on its own
- We don’t have the ability to limit what is logged to the query log, which means in a production environment it will grow very quickly. Ideally, we could set a threshold to only log queries that take longer than a certain duration, or fetch a certain number of time series/data points when they execute, so we only log the expensive queries that we are interested in examining.
How can we optimize our queries?
We’ve seen what options we have to identify slow/inefficient queries within Prometheus. So what options do we have to optimize them? We noted at the start that query performance with PromQL is mostly determined by how many series/data points a query has to operate against, which means we should focus on strategies to reduce the number of series/data points a query has to fetch in order to optimize it. Broadly speaking, there are a few strategies available to us:
Shorten the timeframe that the query is run against
This is obviously not ideal, since it limits our ability to consider trends in the data we are looking at, but it is also probably the fastest option when you have a slow query and need to get the results more quickly.
Reduce the resolution of the metrics being queried
If we lower the resolution of our data, then we’ll reduce the number of data points that have to be processed to evaluate our query over a given period of time. This can be a reasonable approach, particularly when we’re trying to improve performance of queries that look back over a very long window of time. It can be tricky to do in Prometheus though – because Prometheus does not support downsampling data, the only way we have to control the resolution of our metrics is through the scrape interval for the jobs we configure. That doesn’t give us a lot of flexibility – if you want to have fine-grained data for examining recent behavior, and lower resolution data for long-term trends, then you have to configure two duplicate scrape jobs that specify different intervals, which means more load on Prometheus, more complexity, and a more confusing user experience, since users need to explicitly choose which job to query against in their queries.
Some long-term storage solutions for Prometheus do support downsampling data though, so if you are running into this problem they are worth considering if you are not already using one.
Reduce the number of series being queried
This is typically how Prometheus queries are optimized, through the use of recording rules to pre-aggregate the time series being queried under a new metric. Recording rules do have several drawbacks though:
- They need to be defined for each metric/query you are trying to optimize, which means you can quickly end up managing hundreds or even thousands of them as your metric use-cases and data volumes grow
- Additionally, recording rules run in the background on the system, so you’re adding constant load to the database to evaluate them. This means that adding more rules to optimize different queries can become a significant source of work for Prometheus, and leads to its resource needs growing faster than you might expect.
- It’s also worth noting that because rules are evaluated periodically, there can be delays in data from a given rule being available, when compared to when the raw series are available. This gets even worse if you have cases where a recording rule is querying metric names that are generated from another recording rule – the worst case time to new data availability becomes the scrape interval of the data + the execution interval of all of the rules involved in the chain.
- Lastly, we have to remember to use the result of our recording rules in place of the original query everywhere, otherwise we don’t see any benefit. This means our rules need to be discoverable and understood by end-users, they can’t be added transparently in the background and automatically speed up our queries.
In addition to utilizing recording rules, we can also look at removing dimensions from the metrics that our applications emit so there are fewer time series being collected; the obvious tradeoff here is that fewer dimensions means less granular insights into our systems. It’s also not always an option – if you are dealing with metrics from an off-the-shelf application rather than one you’ve instrumented on your own, then it’s not possible to reduce the cardinality of the data being collected without aggregation.
How Chronosphere can Help
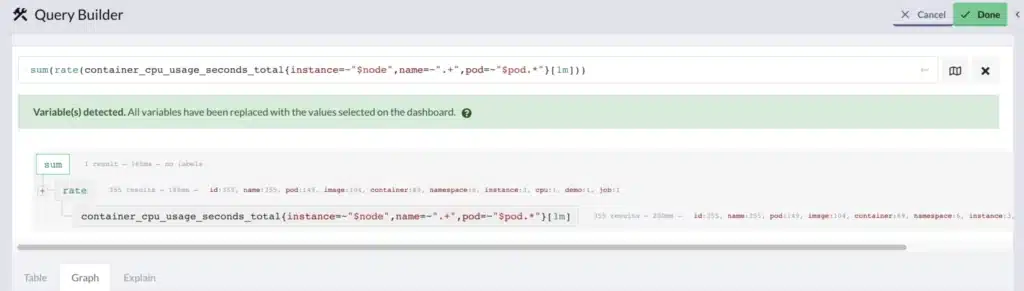
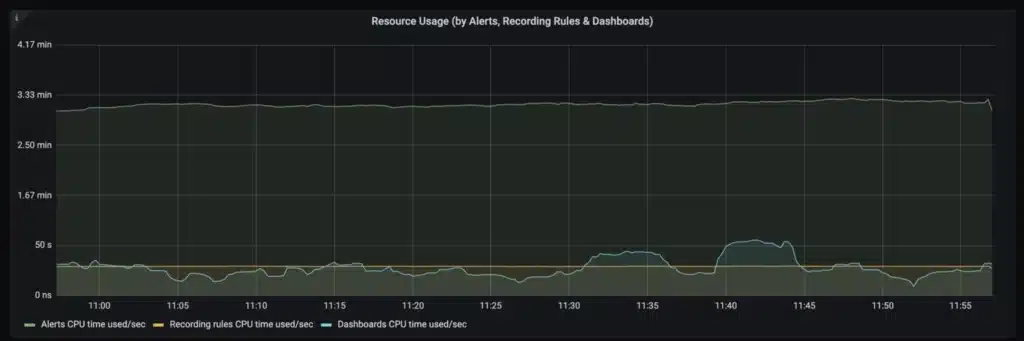
If you’ve read through this post because you’re having trouble with query performance in your Prometheus setup, you’re not alone! As we said at the beginning, this is a common problem that we see, and one that we help with all the time. Chronosphere customers frequently see a significant improvement in query performance simply by upleveling from Prometheus, and they have all the familiar tools available to them to optimize query performance, as well as new ones like Chronosphere’s Aggregation Rules, or our Query Builder to help understand what makes a slow query inefficient. We also provide our customers a detailed view of how they’re querying the system, so it’s easy to understand how the workload is behaving overall:
If you’re interested in hearing more about how we can help upgrade your Prometheus experience, let us know – we’d love to hear from you!


