Prologue: Cautionary tales from the field
At the KubeCon 2023 conference in Chicago, I encountered startling stories highlighting a critical challenge in cloud native environments — the surging costs of observability.
A platform engineer enjoying his lunch at my table shared a bewildering experience: “Our DataDog bill skyrocketed from a steady $3,000 to $17,000 monthly without any obvious reason. This dramatic increase was a wake-up call to the hidden complexities and unforeseen expenses in our monitoring strategies.”
These instances of surging observability bills are increasingly common with the proliferation of cloud native distributed applications. In fact, the pace of observability data growth is so extreme it can lead to observability costing more than the actual application environment.
Another participant chimed in with a similar tale: “Following a software update, we noticed a drastic cost increase. It turned out our development team, aiming for more efficient debugging, significantly amplified logging volume, not realizing the financial impact.” Repercussions from making changes go beyond negative financial impact. If developers are overly concerned about causing a data — and cost — spike they become hesitant to roll out new code.
Similar to my lunch conversations, during a panel discussion at KubeCon, a cloud architect shared an enlightening yet troubling story: “In an effort to enhance performance monitoring, our team integrated several new tracing tools into our microservices architecture. However, we didn’t anticipate the sheer volume of trace data these tools would generate. Within a month, our storage and data transfer costs had tripled, turning what was intended as a performance improvement initiative into a financial burden. This incident highlighted a critical oversight in our cost-management strategy and the need for a more balanced approach to tracing in cloud native environments.”
These narratives I heard while at KubeCon underscore the ease with which organizations can encounter unexpected financial burdens in their pursuit of comprehensive observability in cloud native applications. In the world of distributed microservices applications, companies are able to quickly scale and adapt to customer demand. But as we’ve seen from the tales I shared above, complexity comes with that power. Realizing cloud native benefits requires a cloud native observability approach that provides visibility and insights into every layer of your stack.
Understanding the cost dilemmas in observability
Delving deeper into these experiences revealed several key factors contributing to the cost complexities in cloud native environments, which are characterized by a mesh of microservices communicating through APIs and often employing diverse technology stacks. This complexity is not merely due to the increased quantity of elements to monitor, but is exacerbated by the distributed ownership of these microservices. Different teams managing various services can inadvertently introduce costly oversights, particularly in an ecosystem geared towards continuous software deployment.
For instance, one team’s well-intentioned comprehensive logging for debugging could unknowingly lead to substantial cost escalations at scale. Another team might deploy a service with default configurations that generate a high volume of detailed metrics, again adding to the cost. The diversity in technology stacks complicates the establishment of consistent monitoring practices, making it challenging to optimize and standardize logging and monitoring across all applications.
Moreover, the dynamic nature of cloud native environments, where services can be rapidly scaled, further contributes to the unpredictability and variability of logs and metrics. This situation highlights the importance of careful planning, enforcing consistent policies, and fostering collaboration between development and operations teams to maintain cost-effective observability.
Case study: Kubernetes configuration pitfalls
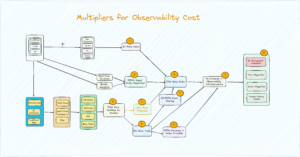
Kubernetes is the de facto standard platform for cloud native applications. Therefore, it is startling how quickly observability costs can spiral out of control when not carefully managed, aligning with several key factors indicated in the chart.
- More users: As Kubernetes caters to numerous personas, from DevOps to security engineers, the number of users requiring observability has multiplied. With often five times more users tracking and analyzing the system, the demand for data has surged.
- Higher data resolution: Kubernetes clusters are often monitored with high-resolution metrics for precise real-time analytics. This 1,000x increase in data resolution can lead to a significant escalation in storage requirements and costs.
- Entities to monitor: A single Kubernetes environment can have hundreds of pods and containers, increasing the number of entities to monitor by a hundredfold. Each of these entities emits its own set of metrics, intensifying the volume of data collected.
- Frequent releases: With Kubernetes facilitating continuous deployment, the frequency of releases may rise by 20x. Each release potentially introduces new metrics or alters existing ones, thus increasing the observability footprint.
- Tool multiplicity: Kubernetes environments typically utilize an array of tools for monitoring different aspects, leading to a tenfold increase in the number of tools employed. This not only adds to the complexity but also to the cost, as each tool comes with its own pricing model.
- Data volume: With Kubernetes, there’s a substantial increase in data generated due to its distributed nature, easily leading to a 100x more data that needs to be managed.
- Data overlap: As different teams and tools collect data, there’s a 50-100% overlap in data collected, causing redundancy and unnecessary cost implications.
- Data transfer: Moving this data across systems, especially in a multi-cloud or hybrid environment, results in a 500x increase in data transfer, directly impacting costs due to network usage and data egress fees.
- Infrastructure scaling: As observability needs grow, so does the infrastructure to support it, leading to a 5x increase in infrastructure costs, including storage and computing power.
- Management overhead: The complexity of integrating various tools, managing data from multiple sources, and navigating complex pricing models leads to a fivefold increase in management overhead.
These factors demonstrate the intricacies involved in Kubernetes observability and the importance of strategic cost management to avoid falling into the observability cost trap.
Optimizing observability in complex and dynamic cloud native environments
The theory is simple. Optimizing observability cost involves collecting precisely the right type and amount of telemetry data required by developers to understand the performance characteristics of their applications. This data is crucial for cloud engineers to monitor and optimize both infrastructure and application health and performance. It’s about striking a balance between data comprehensiveness and cost-effectiveness. Too little data can lead to blind spots in understanding system behavior, while excessive data can incur unnecessary costs and complexity. The goal is to gather meaningful, actionable insights without overwhelming the system or the team with superfluous information.
Why Chronosphere was named an EMA Allstar

Chronosphere’s Control Plane provides a set of capabilities aiming to reduce observability costs and improve performance. For example, Control Plane provides a Metrics Analyzer to help users understand their metric data in real-time, and filter/group by any metric labels to manage metrics at scale. This ensures that spending more money on observability is always a conscious, deliberate decision of the customers.
In a nutshell, Chronosphere’s Control Plane provides a comprehensive solution for optimizing observability in complex and dynamic cloud native environments. It offers a balance between data comprehensiveness and cost-effectiveness, enabling teams to gather meaningful, actionable insights without overwhelming the system or the team with superfluous information.
Last words
Optimizing observability involves a strategic approach to telemetry data management, ensuring that only essential, actionable insights are gathered. This approach not only prevents cost overruns but also enhances the efficiency of cloud native applications. Solutions like Chronosphere’s Control Plane exemplify this strategy by offering a unified platform for telemetry data management, ensuring that investments in observability are deliberate and yield tangible benefits.
As cloud native technologies continue to evolve, it is imperative for organizations to remain vigilant about observability costs. By adopting a balanced and strategic approach, they can avoid the pitfalls of the observability cost trap, ensuring that their pursuit of comprehensive visibility does not impede innovation but rather supports it.
To learn more about Chronosphere’s capabilities, schedule a demo today.


