")
As observability costs are skyrocketing from high cardinality, companies are looking at cuts and caps to control spending on their cloud native environments. However, removing unnecessary data proves tricky, time-consuming and risky when observability teams must use legacy tools to identify and eliminate metrics.
To kick off our three live demos, Chronosphere’s Senior Product Marketing Manager, Scott Kelly, joins forces with Senior Sales Engineer, John Potocny, to break down the magic behind the Chronosphere Control Plane, and how its unique set of tools allows teams to control long-term data growth, while ensuring engineers have all the information they need to troubleshoot and innovate.
What does Chronosphere do?
John: Before we dive straight into the demonstration and product, we’ll just do a quick overview of what Chronosphere is and what we do. We’re an observability platform. We support ingesting metric and trace data in open source formats. If you’re using things like Prometheus, OpenTelemetry, we’re fully compatible with those sources.
The main thing that separates Chronosphere from other solutions is the Control Plane. This is what we’re going to focus our conversation around today. This is going to let you, as a customer, analyze the data that you’re sending to us, shape it to match your needs, and get a lot more overall understanding of what value you’re getting from your data and a lot more ability to manage it as your organization grows and your observability needs scale. I won’t talk too much about the data store underneath it. Just know that it’s based on the open-source M3DB technology that was developed at Uber. It’s been proven to scale to as high as 2 billion data points per second – also a 100% open source compatible on the consumption side. So, 100% PromQL compliance, and we are able to use things like alert manager definitions for alerts, and Grafana dashboards for visualizing data.
Scott: We’re going to go over the Control Plane, which is really important in the new world of cloud native. And, we’re going to walk you through a lot of features, but also talk to you about why they’re important with regards to cloud native.
John: We’re going to talk about how you can use Chronosphere’s Metrics Quotas to contain data explosions when you have unexpected cardinality that would result in overages or downtime in other systems. We’re going to talk about how you can analyze your metric traffic to understand how expensive it is, where it’s used, who it’s being used by, and understand the cost versus utility that your data is providing to you. We’ll talk about how you can apply aggregations to shape that data, so that you can better align it to the value that you’re actually getting from its practice.
Then [we’ll also talk about] how Chronosphere helps to improve performance by automatically optimizing slow queries that are showing up in your workload over time.
How Chronosphere addresses high cardinality
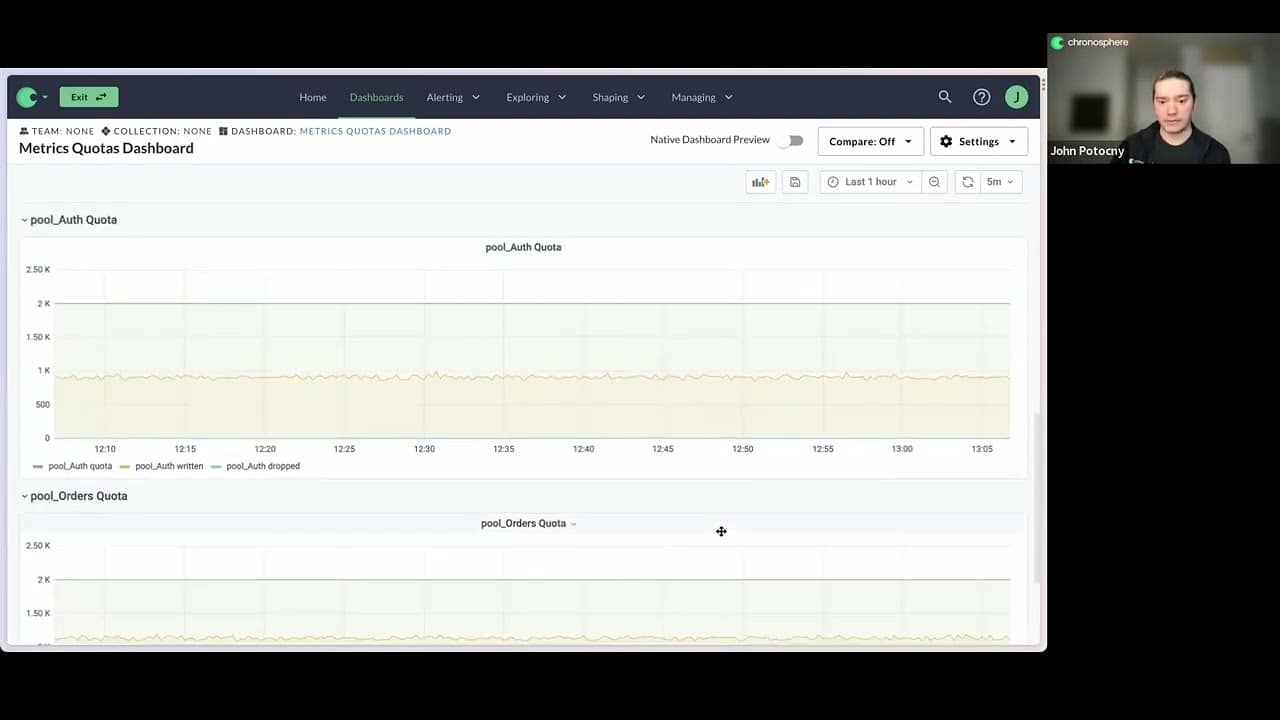
John: When you’re dealing with high cardinality data, particularly in cloud native environments where you have a lot of ephemeral infrastructure, it’s really easy for seemingly innocuous changes to introduce a huge increase in the volume of data that’s being produced. One of the things that we do at Chronosphere is give you the ability to very easily manage, when this happens, reduce the scope of who is impacted, understand what happens very quickly and trace it back to the source, so that its impact on everyone is limited. The primary way that we do this is through the ability to set quotas in your environment.
We have a dashboard showing quotas for my tenant. I’ve got an overall capacity that I set in Chronosphere of 50,000 data points per second. I can break that capacity down into groups, based on any shared aspect of my workload. So, I’ve got a handful of applications that are sending data to my tenant.
The big question of volume and cost
Scott: I think a good point here to make too, is that we’re delegating responsibility, right? It was generally developers who would deploy and create metrics. All metrics are important, right? So, nothing ever got dropped and everyone just kept consuming, and the price of cost and data volumes kept going up and up. They never had any context to understand how their changes were actually making, or impacting the overall system. I think what this helps to do is start to put some focus by those service team developers on the metrics that they’re creating: How much volume is there and what are they costing? I also think you want to talk about what’s coming in terms of prioritization, and how that can help – so it’s not just: “The most important metrics are being dropped.”
John: Yeah. The way that this works is that it’s designed to produce the scope of an issue. If somebody introduces a problem, and all of a sudden the volume of data is completely out of whack, we’re going to minimize who can be impacted by that, to just the area where it was introduced. But, that doesn’t mean that we want the off service to have an all hands-on-deck fire. We want to make sure that they can still get critical visibility into that service.
You have critical metrics that are part of this workload that are going to be used for things like alerting you about how the system is behaving, and making sure the service is available, and not in an error state. Those are metrics we want to preserve. Other stuff might be less valuable.
[This scenario is] where we want to apply quota enforcement. And so, that’s something that’s actually coming soon on the platform – you’ll be able to enforce priorities and say: “These are the metrics that are high priority to me. I care about them, I use them. The other things are less important. It’s okay if that data actually gets dropped as product code enforcement.”
I do want to stress that this is really about handling that unexpected case where somebody makes a change and it has a way bigger cost and impact on the system than you would expect. It’s very easy to go in and adjust the capacity available to you in Chronosphere.
The expected case that people have when you sign up for a “pay-as-you-go” service is that, whenever there’s an increase in your utilization, it’s by design. And that’s no different with Chronosphere — where it’s very easy to go and increase your utilization by design. But when it’s not by design, you don’t want to have a vendor turn around, take all that data and then bill you a huge amount for information that was ultimately not really valuable or what you were trying to do. And, that’s what we’re trying to correct here — that “not expected case” where things do not go as planned.
Scott: To reiterate, if there’s extra capacity in the system, by default, you will be allowed to exceed that quota. You’ll get notified, and then you have time to remediate it. But it’s in those cases where you might be right at the edge, where it’s a hard quota set. But, that’s up to the administrators.
But there’s also things you can do, right? So, if this is happening, it’s not just “Oh, it’s going to get dropped and there’s nothing I can do about it.” You can actually do things, and start to analyze, look at it, and make changes.
Alert, alert: Exceeding quotas and the Metrics Usage Analyzer
John: So, I mentioned before, that you can alert on when you’re getting close to your quota, when you’re exceeding it. Just to show an example of what that would look like, here’s an alert that we’ve got defined for if somebody’s exceeding their quota in the system.
And when that happens, you can set this up, so that notifications are dispatched to the members of the team that are responsible for that service, or that portion of the workload. And they can go into Chronosphere very quickly, and understand what has shifted in their traffic that’s causing them to send more data than they anticipate.
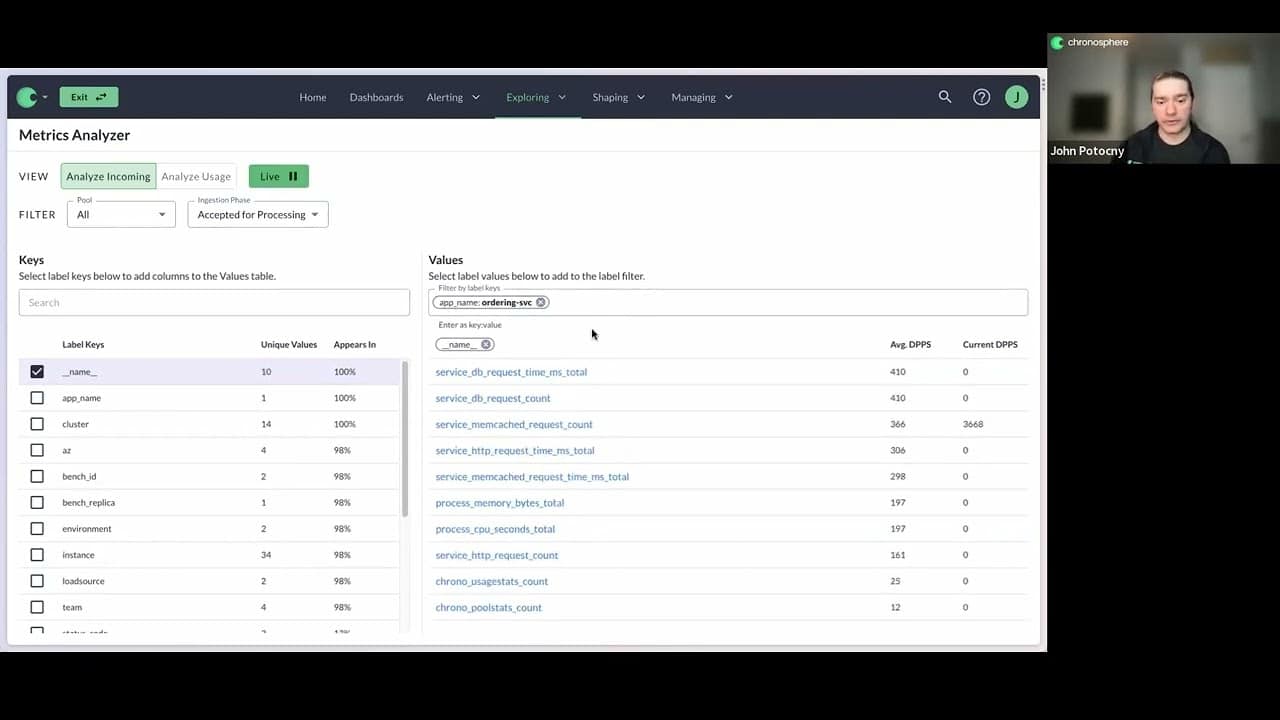
One of the main things that we have available in the platform to help with that, is our Metrics Usage Analyzer. What this will let me do is take a look at the live traffic that’s actually coming into Chronosphere in real time, and understand the metrics that are involved, how much they cost, what dimensions they have associated with them, and what the cardinality of those dimensions looks like.
What is a cardinality explosion?
Scott: Someone asked: “What does cardinal explosion mean?” Maybe we should define that, just to be clear.
John: Yeah, absolutely. What we mean when we talk about a cardinality explosion, is that if you have a metric that you’re tracking — let’s do something specific — you’re looking at the request per second going into a particular service — you’re going to have different dimensions.that you add to that metric to understand request per second, broken down by different things. The endpoints that service has is probably going to do more than one thing.
If you have it broken down by endpoint, you might do things like the HTTP method – another dimension that you had — that has multiple values. There’s also the status response for those requests that are going into the application. All of these dimensions that we add have some number of values that you can track them by. The total across all of them ends up being the cardinality of the metric; it’s not additive, it’s multiplicative.
So, if I have one service with five endpoints and there are two different HTTP methods for each endpoint, and five different status codes, then you’ve got 5 (endpoints) x 5 (status codes) x 2 (HTTP methods) different time series that you’re tracking.
If you start adding additional instances of the service, then you’re going to have that for every single container, and every single instance of the service that you’re running to. If I go and add another dimension to it, like: “Hey, I want to know what users associated with the request,” that might be something that has way too many unique values.
There’s too many users that could be requesting in the service, where the number of time series that you’re tracking has now increased significantly. Let’s say there are 10,000 users that could be requesting the service. You’ve got 5 (endpoints) x 5 (status codes) x 2 (HTTP methods) x 10,000 (users). That would be a cardinality explosion.
We’ve significantly increased the amount of data that is being tracked by that particular metric in the system. Or you can add a new metric and it’s just much more expensive than you expected, because there’s more unique values than you anticipated.
More changes brings more mistakes and costs
Scott: These are pretty common [scenarios] in a cloud native environment, right? As you break teams into smaller teams, and they’re focused on smaller services, doing independent deployments frequently, cardinality explosions become kind of the norm, because people are introducing new values and metrics and not understanding how they impact it in production.
John: Yeah, it’s super easy to do this. You don’t understand the cardinality of a metric, as it exists. You can add something that’s seemingly innocuous, and it turns out it has a really big impact, because that was an expensive metric already. You can add something and not realize what it’s going to look like in production. It’s very easy to go and do something and test it out in a local dev environment or a staging environment, where the cardinality is much smaller, and then production proves that your staging environment is production-like, and so you got a hundred times more time series than you were expecting.
This happens all the time. And to your point, Scott, the more teams, the more services, the more changes you have going on, the more chances there are that somebody’s going to make a mistake and do something that’s really expensive.
John: If you have a cardinal explosion , we’ve talked about how you can limit the scope of the impact. Only the team that introduces the problem is going to get impacted. Everyone else is going to have the same experience they’ve already been having.
You can notify that team when it happens. They can take a look right when the problem is introduced, and not have it be kind of working behind the scenes. And when you do have something like this show up, it’s going to be really obvious.
Breaking down workloads
John: I want to quickly highlight as well, that you can break down the workload that you’re looking at in the metric analyzer by whatever you want. I’m looking at all the metrics from the ordering service right now, but if I want to see data broken down by each cluster in my environment, I can change the groupings.
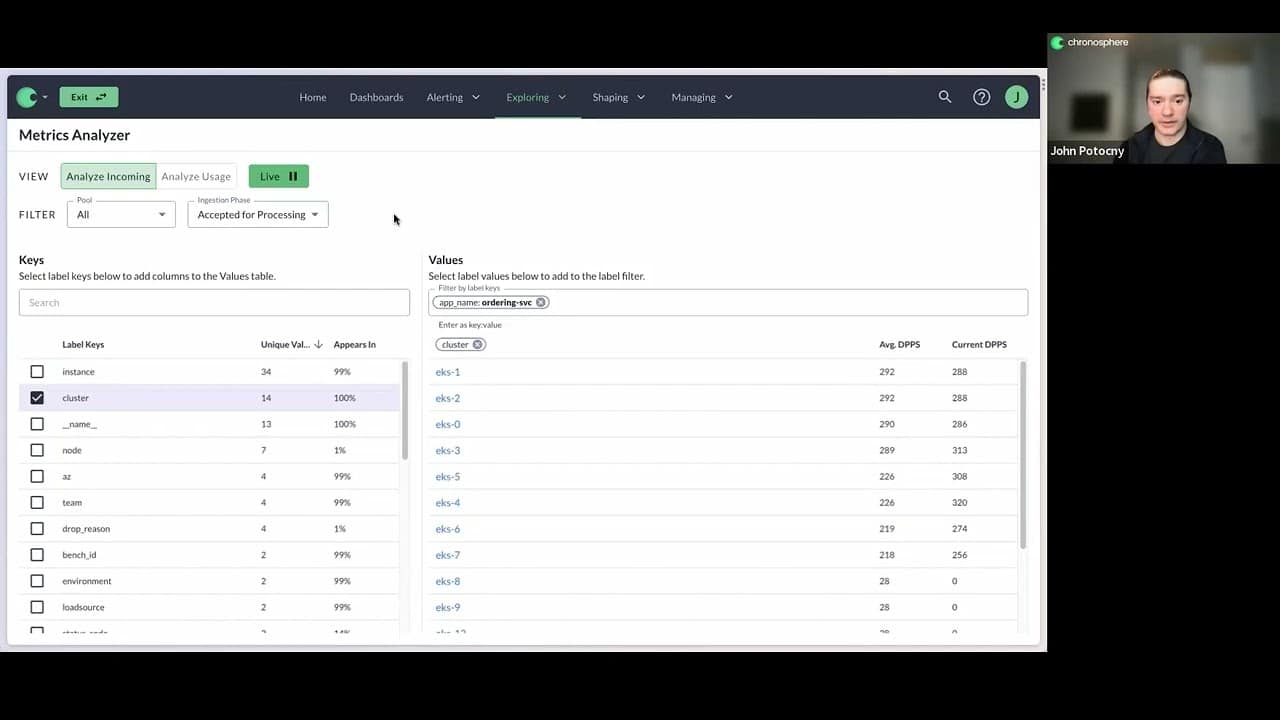
Being able to understand this type of information makes it a lot easier to manage these types of problems that can occur in more complex environments, where you’ve got a lot of changes going around in a lot of services, and it’s hard to track things back down to the source.
Viewing historical choices to stop a cardinality explosion
John: You want to focus on making sure that what you’ve already got in the system is efficient, beneficial, good, and is worth the cost that you’re paying for it. Being able to quickly identify when there’s a problem, and undo that problem, is one thing. But being able to look back at your historical choices and say: “Have I done the right thing for the business?” is a whole matter entirely.
Talking about addressing the problem quickly — one of the unique things about Chronosphere, is that you actually don’t have to have developers involved if you want to do something to stop a cardinality explosion.
Basically, you can do that: Write a creator shaping rule, you can drop the metric, no developer. And, we don’t only charge you for what you’re storing, not what you’re ingesting. I think that’s another key differentiator. So, you’re seeing this coming in real time, and you can actually drop that metric before it hits your database. It’s still being sent. It’s just not being stored, and you’re not paying.
When you have this sort of problem, reverting the change that introduced the issue is not super practical. You don’t necessarily have to go and fight down that road. If it’s a new metric, write a drop rule to filter it out. We just won’t store it. We’ll go back and fix it, and then undo that drop rule. If it’s a new dimension on an existing metric, and you don’t want to lose the whole metric, we can write an aggregation rule and that’ll allow us to actually remove the instance from the dataset before we store it in the database.
You can go back to the status quo using shaping rules and Chronosphere, without having to go back and undo the change in code.
Continue this part of the conversation at minute 19:23.
Detecting and controlling metrics increases
John: Here’s a question: “Is there a way to detect and control sudden increase in metric points for a given service that could start throttling other important metrics?” Yeah, absolutely. We have fine-grained visibility into the data that’s coming into Chronosphere. In addition to the Metrics Usage Analyzer, you can break information down by arbitrary labels. We showed this a little bit when we talked about quotas.
In my tenant, for example, I have the data points per second being generated by every service in my Chronosphere environment. Because we’re fully compatible with things like PromQL, you can write very expressive alert queries. It’s quite straightforward actually for me to do something like compare the data points per second for all of my applications, to what it looked like at whatever time frame you want historically. And, if I see more than a 10% jump, I want to get notified about that and take a look at what’s going on. That’s a completely reasonable thing to do. It’s something that our customers do too, in practice.
Finding metrics that are just not being used at all, is a great way to trim back unnecessary spend, and be a little bit more efficient. This is definitely something that, I’m sure, is interesting to a lot of people right now, given the wide focus on cost efficiency that we’re seeing across the industry.
There’s also, the more interesting use case of: “Show me the metrics that are being heavily utilized, or are expensive, and I want to see if they’re actually justifying their cost.”
The power of the Metrics Usage Analyzer
John: We can rank our metrics based on cost. We can rank them on utility. We can compare cost and utility, and come up with a definition of what is the most valuable. The Metrics Usage Analyzer is designed to help with all of these cases.
If you recall, when I looked at the Metrics Usage Analyzer for incoming traffic, I saw a lot of service underscore metrics, powering my ordering service. I can search for all of those and see what they look like, and what their utility looks like.
For the ones where they’re being used, we take a look at an active example of a metric that actually has a fair amount of utility, right? It’s being used in a lot of different dashboards. It’s got a lot of different query executions. It is more data points per second, but we can see where the cardinal is coming from, for this metric, and for each label on the metric.
- How many unique values does it have?
- Are those values referenced?
- Anywhere in the configuration?
- Are people querying for data by this dimension, or is it a dimension that doesn’t actually add utility?
This makes it really interesting, because we’ve got data that is clearly valuable to us, where we’re querying this metric in a lot of places. But, we’re looking at it by cluster. We’re breaking it down by application name or by availability zone. We’re not looking at it by instance. And, if I look at the dimensions on this metric, instance is the highest cardinality 1. This is contributing a lot of cost, but it’s not actually driving any value for me.
More efficiency and less cost for metrics
John: When you have a metric that is being used, but is also very expensive, we can start to have a deeper discussion about, is this justifying the expense, or are there ways that I can make it more efficient and less costly to the business? The ability to do shaping on your workload can come in handy.
So, for my HP request, time, total metric, I clearly am not using the instance label. It’s not being used anywhere in the system that we can see in the last 30 days. If we could just store this metric, without the instance label, it’d be significantly cheaper. And shaping rules, aggregation rules, in Chronosphere let you do just that.
Scott: For the roll up rule, somebody might say that recording rules can do a lot of the aggregation stuff too, right? But roll up rules are something that we’ve created that is a little bit more unique. So, it allows you to drop data if you choose to do that, whereas a recording rule won’t.
John: Good point. With recording rules, you’re writing data into the storage platform. Then, you’re querying that data back out in order to do aggregations or shaping on it, and you create a whole new metric.
Controlling cost with aggregation rules
John: With Chronosphere aggregation rules, we’re actually doing this in streaming fashion as the data comes into the platform. So I have the option to stop storing my original version and only store aggregates that are omitting certain dimensions that I’m not using in the system. And, that way you’re able to get a much lower cost, in terms of data points per second, much better performance, and there’s less data that you have to query in order to load your dashboard, without having to store all of that raw data originally.
John: When you’re making these shaping decisions, when you’re doing aggregation, if you drop the raw data, then you can save a significant amount in cost, and we can help show you exactly where it’s beneficial to do that, by helping you identify these unused dimensions in your workload that no one’s actually querying on against.
Anywhere you come in the Metrics Usage Analyzer, and you see there’s a dimension that just has no utility, no references, it’s a candidate where you can go and add an aggregation rule to remove that dimension and save money. And, these rules that we’ve mentioned a couple times here, they can be very targeted. You can roll up a specific metric and remove a given dimension. You can also create some broad policies in the system as well.
Scott: I think that’s also what we talked about earlier. You’re aggregating in a way, but it’s still being sent. So, if you need that back, it’s simply making a modification to that rule that allows it to be persisted in the database again, so that it’s not being taken away, and you’re just not paying for it anymore, or storing it.
John: It’s very easy for you to go and turn it back on, if you decide that you actually need that dimension you’ve removed. Because this is being done server side, it’s not a case where you have to go and make a bunch of instrumentation changes in order to ship the workload. We’re doing it all for you in a much more flexible fashion.
With real data to help you make these decisions, you can be confident about the choices that you make when you’re able to pull a report and say: “Look, no one’s used this in the last 30 days. It’s not referenced anywhere. And if we get rid of it, it’s going to reduce the cost of these metrics by 50%.”
That’s a pretty compelling case to, I think, any organization. And, it’s exactly the kind of data that you’ll have at your fingertips with Chronosphere.
Curious to hear the rest of the conversation? Continue this live demo at minute 31:04.


