
If you need to reduce the amount of metrics data stored in your time series database (TSDB) or improve query performance, there are generally two common methods to do so:
- One option is downsampling. With standalone Prometheus, this typically means reducing the sampling rate of emitted metrics and thus the fidelity of a set of metrics. With Chronosphere, downsampling means choosing how and how long to store metrics.
- The other option is aggregation, which focuses your metrics data on what’s most important to your use case to make querying more performant.
Many tools (including Chronosphere) offer methods to perform both operations and focus instead on when you want to aggregate and downsample metrics before or after storing them.
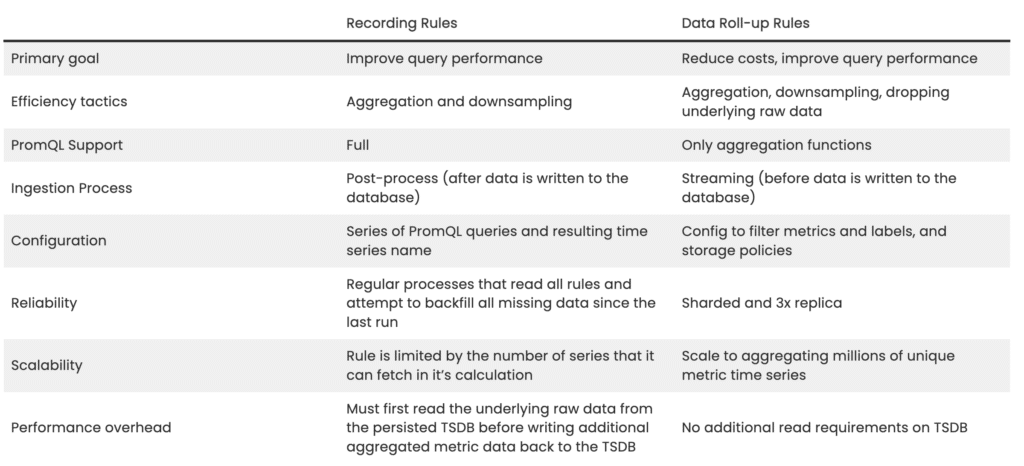
Chronosphere has two methods or rules available, “recording rules,” which are part of Prometheus, and “roll-up rules,” which are unique to M3 and Chronosphere.
Recording Rules
The primary purpose of recording rules is to improve performance on commonly run queries. Recording rules ingest all the raw metric data into the database first before reading it and then producing the aggregated and downsampled metric data back into the database.
You configure a recording rule with a PromQL statement (that can include any PromQL function) executed against the TSDB with the result stored in a new time series with a unique metric name. If you can write PromQL, you can write a recording rule, but creating a rule often needs multiple steps, especially for any queries involving rate.
For example, below is a rule that calculates the per-second average rate of increase for a particular job as measured over one minute. It then calculates the totals per instance over one and five-minute measurements.
- record: instance_path:requests:rate1m
expr: rate(requests_total{job=”myjob”}[1m])
- record: path:requests:rate1m
expr: sum without (instance)(instance_path:requests:rate1m{job=”myjob”})
- record: instance_path:requests:rate5m
expr: rate(requests_total{job=”myjob”}[5m])
- record: path:requests:rate5m
expr: sum without (instance)(instance_path:requests:rate5m{job=”myjob”})
To then read the resulting series, you need to know the names of each of them (for example, path:requests:rate5m) instead of the original requests_total series. This leads to a proliferation of recording rules, potentially thousands, but at least one for each metric name.
Reliability
You generally implement recording rules via cron-job type processes that read all rules and attempt to backfill all missing data since the last job run.
This ensures that if the job dies, you can spin up another job and catch up on any missing processing. The disadvantage to this approach is that aggregated or downsampled metric data lags if there is a failure.
Scalability
To scale a recording rule, you add more instances of cron-jobs that shard the rule evaluation between them. The disadvantage of this approach is that each rule can take an indeterminate amount of time, and thus, sharding evenly is harder to achieve.
The number of series limits each individual rule that it can fetch in its calculation. Many TSDBs can’t sustain a fetch of 10s of millions of active time series, and for those that can, they need to keep the resulting data in memory during the rule evaluation. This necessity leads to large resource requirements by the cron-jobs and a greater cost to re-evaluate the expression, often pulling all matching series from storage.
Performance
Recording rules must read the underlying raw data from the persisted TSDB before persisting the additional downsampled or aggregated metric data back to the TSDB. The data required for these rules are always the most recent datapoints, which are typically the most performance constrained as that’s where the most recent raw datapoints are actively written.
Time to Results Availability
Recording rules have to wait for the raw data to be persisted to the TSDB first, then perform a read, a calculation, and write back to the TSDB before the downsampled or aggregated metric data becomes available for reads. This often leads to a delay in acquiring results.
The primary purpose of roll-up rules is to reduce costs and improve performance on commonly run queries. Roll-up rules aggregate and downsample metric data in memory on the streaming ingest path before storing the results in the database. You can also use dynamic suffixes in metric names to use the same value in the resulting series. Roll-up rules don’t support all PromQL functions, only aggregation functions, and you need to apply transformation functions and query time. This makes roll-up rules more flexible but requires rethinking how you might have previously constructed rules.
Roll-up Rules
For example, the rule below applies to all incoming metrics that are counters and aggregates them over the instance label. It concurrently stores the results series at 1m resolution for 120 hours and at 5m resolution for 1440 hours.
- aggregation: SUM
filter: __name__:*
exclude_by:
- instance
metric_type: COUNTER
name: sum counters without instance
slug: sum_counters_without_instance
new_metric: '{{ .MetricName }}'
storage_policies:
- resolution: 1m
  retention: 120h
- resolution: 5m
  retention: 1440h
This means you create fewer roll-up rules to manage over time, and each rule has a greater impact.
Reliability
M3 and Chronosphere implement roll-up rules via a streaming aggregation tier that shards all the incoming metric data (for horizontal scale) and then replicates it across the tier for reliability. Replicas leader-elect amongst themselves, and while all replicas perform the aggregation and downsampling, only the leader is responsible for persisting results to the TSDB.
The leader reports status to a consistent store (etcd), and the followers wait until the leader has reported that it successfully persisted data before discarding its copy. This ensures no data loss if a leader election is required.
Scalability
Roll-up rules use a sharded streaming aggregation tier. If you run M3 yourself, as you create more rules, you add aggregation nodes to share the work of the aggregation tier.
Since aggregations happen in memory and focus on the resulting series, roll-up rules scale to aggregating millions of unique metric time series. For example, when creating an aggregate sum on a counter metric type, instead of reading millions of metrics from storage or keeping millions of metric datapoints in memory, each metric value is atomically incremented in a single result series memory.
Performance
Roll-up rules have no additional read requirements on the underlying TSDB, and it only needs to persist the additional downsampled or aggregated metric data to the TSDB.
Time to Results Availability
As roll-up rules (streaming) don’t have to wait for the raw incoming data to be persisted first into the TSDB, they can write the downsampled or aggregated data as soon as the time window has passed. This lack of delay means that results are available immediately.
Cost Efficiency vs Data Loss
One other major advantage of roll-up rules over recording rules is that you can choose to discard the raw underlying data and only keep the downsampled or aggregated data. This means that if there is no use for the raw unaggregated data, you don’t have to store it. With recording rules, you need to store the raw unaggregated data in order to calculate the recording rules.
This advantage helps you control compute and storage costs over time. However some may be wary of dropping labels from recorded metrics, in case you may need them in the future.
Chronosphere provides tools to identify labels you’re not using and create a roll-up rule that aggregates across these unused labels in the streaming aggregation tier to stop persisting these labels in the first place.
For example, Chronosphere has found that the most common label to drop and aggregate across is the instance label inserted by Prometheus to every target it scrapes. Prometheus adds this label to differentiate cumulative counters with the same name from different instances and is something many end users aren’t aware of.
Instance counters can also increase the cardinality of metrics by the same multiple as the number of instances of a particular service. If there are 20 instances of a service running on 20 different Kubernetes pods, Prometheus includes the 20 unique values and increases the cardinality and datapoints per second by 20 times.
Many emit the same metrics without a differentiating instance label to measure the overall performance of services, not a per-instance view, especially with Kubernetes, which reschedules instances all the time. Instead, they add an instance (or pod) label and don’t rely on the Prometheus inserted instance label.
Chronosphere customers who applied a roll-up rule across the Prometheus instance label often see their cardinality and persisted write volume drop from 10 to 20 times, reducing the cost of their metric platform by 10 to 20 times. Read more about using Chronosphere roll-up rules to control costs.
In conclusion, which should you use: roll-up rules or recording rules? The good news is that you don’t have to choose. Chronosphere and M3 support both recording rules and roll-up rules, so you can get the best of both worlds, and the rule that suits your use case best.
Whitepaper: Breaking Vendor Lock-in with Prometheus
Get the tools you need to adopt open source and break free of your observability vendor


