

In the early days of an enterprise, monitoring might have been an afterthought. Then, as systems grew, different teams, driven by project requirements, adopted various tools. The backend team embraced StatsD for its simplicity, funneling metrics into Graphite. Infrastructure engineers relied on syslog or Nagios checks.
Later, as containerization took hold, another department adopted Prometheus for microservices. Fast forward to today, and the latest applications are being built with OpenTelemetry (OTel) instrumentation, sending metrics data via the OpenTelemetry Protocol (OTLP).
This monitoring sprawl becomes unsustainable. Correlating issues across systems is complex, and managing different systems and configurations drains resources. The need arises to standardize and consolidate, but ripping out existing instrumentation is often impractical. How can you bridge these diverse metric sources — StatsD, Prometheus exporters and OTLP — into a central Prometheus system without adding more complexity?
Enter the OTel Collector. It acts as a powerful, vendor-agnostic aggregation layer and protocol translator. We’ll show you how to use the OTel Collector as a central hub to seamlessly ingest metrics from these varied sources, process them consistently and send them to Prometheus, which simplifies your architecture and paves the way for unified observability.
Prerequisites
- Docker and Docker compose: We’ll use containers to run Prometheus, the OTel Collector and sample metric sources. For installation, refer to this guide.
- Basic understanding of Prometheus: Familiarity with Prometheus concepts like scraping, metrics formats and Remote Write is helpful. Review the Getting Started with Prometheus workshop for an introduction.
- Basic understanding of OTel Collector: Knowledge of receivers, processors, exporters and pipelines. If you’re new, check out the official OTel Collector documentation.
The Trouble With Heterogeneous Monitoring Landscapes
Heterogeneous monitoring landscapes, where your environment is a mix of old and new technologies, are common among evolving organizations.
Here is a scenario:
- New services: Your latest microservices are being built with OpenTelemetry software development kits (SDKs), emitting metrics using OTLP and sending them to Prometheus using some intermediary.
- Infrastructure tools: You have existing tools or infrastructure components (such as databases or proxies using exporters like node-exporter or mysqld-exporter) that expose metrics in the Prometheus format on a specific HTTP endpoint.
- StatsD emitters: Older services or specific tools are sending metrics using the StatsD protocol over User Datagram Protocol (UDP) to Graphite.
While each component may be monitored in some way, this heterogeneity creates operational friction. Without a central aggregation layer, you face several challenges:
- Complex Prometheus configuration: Prometheus needs scrape configurations for each exporter and application. Managing a large and dynamic list of these targets can become challenging.
- Multiple ingestion paths: OTLP data may require a dedicated OTLP-to-Prometheus bridge or specific receiver configurations, depending on whether Prometheus supports them directly. In contrast, every infrastructure tool (e.g., MySQL, MongoDB) requires its own exporter.
- Inconsistent metadata: Metrics from different sources may lack a standard identifying label (such as environment, cluster or application group), making correlating data and creating a unified dashboard difficult.
- Maintenance overhead: Managing multiple agents (such as statsd_exporter, potentially others) and complex Prometheus scrape configurations increases the operational burden.
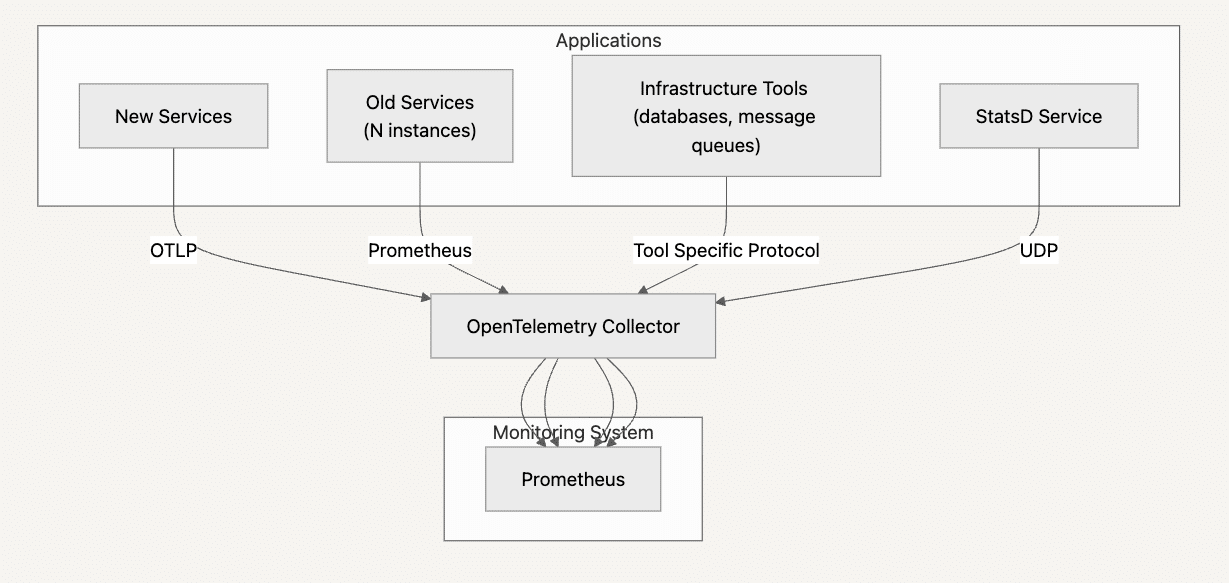
This diagram illustrates the multiple paths and potential systems needed, along with the configuration burden placed directly on Prometheus.

Buyer’s Guide: Telemetry Pipelines
Build a smarter telemetry pipeline. Download The Buyer’s Guide to Telemetry Pipelines
The OTel Collector Solution: A Unified Ingestion Point
The OpenTelemetry Collector acts as a “Swiss Army knife” for telemetry data. By deploying it between your metric sources and Prometheus, you can simplify the architecture.
Here’s how it works in our scenario:
Receivers: The Collector is configured with multiple receivers:
- OTLP receiver: Listens for OTLP metrics (gRPC and/or HTTP) from new services.
- Prometheus receiver: Actively scrapes the /metrics endpoints of your legacy Prometheus exporters.
- Statsd receiver: Listens for StatsD metrics on a UDP port.
Processors: The Collector can process the metrics flowing through it. A key use case is adding standard metadata using processors like the resource processor to ensure all metrics sent to Prometheus have consistent labels (e.g., environment=”production”, k8s_cluster=”main”).
Exporters: The Collector then exports the unified, processed metrics to Prometheus using one (or both) of these methods:
PrometheusRemotewrite exporter: Pushes the metrics directly to Prometheus’s remote write endpoint. This decouples the Collector from Prometheus’s scrape cycle.
Prometheus exporter: Exposes a new /metrics endpoint on the Collector itself. This endpoint contains the aggregated metrics from all configured receivers. You then configure Prometheus to scrape only this single endpoint from the Collector.
This approach centralizes the complexity of handling diverse sources within the Collector, allowing Prometheus to focus on its core strengths: storage, querying (PromQL) and alerting.
This diagram shows the Collector acting as the central hub, simplifying the connections and configurations for Prometheus.
Unifying Metrics With OpenTelemetry Collector
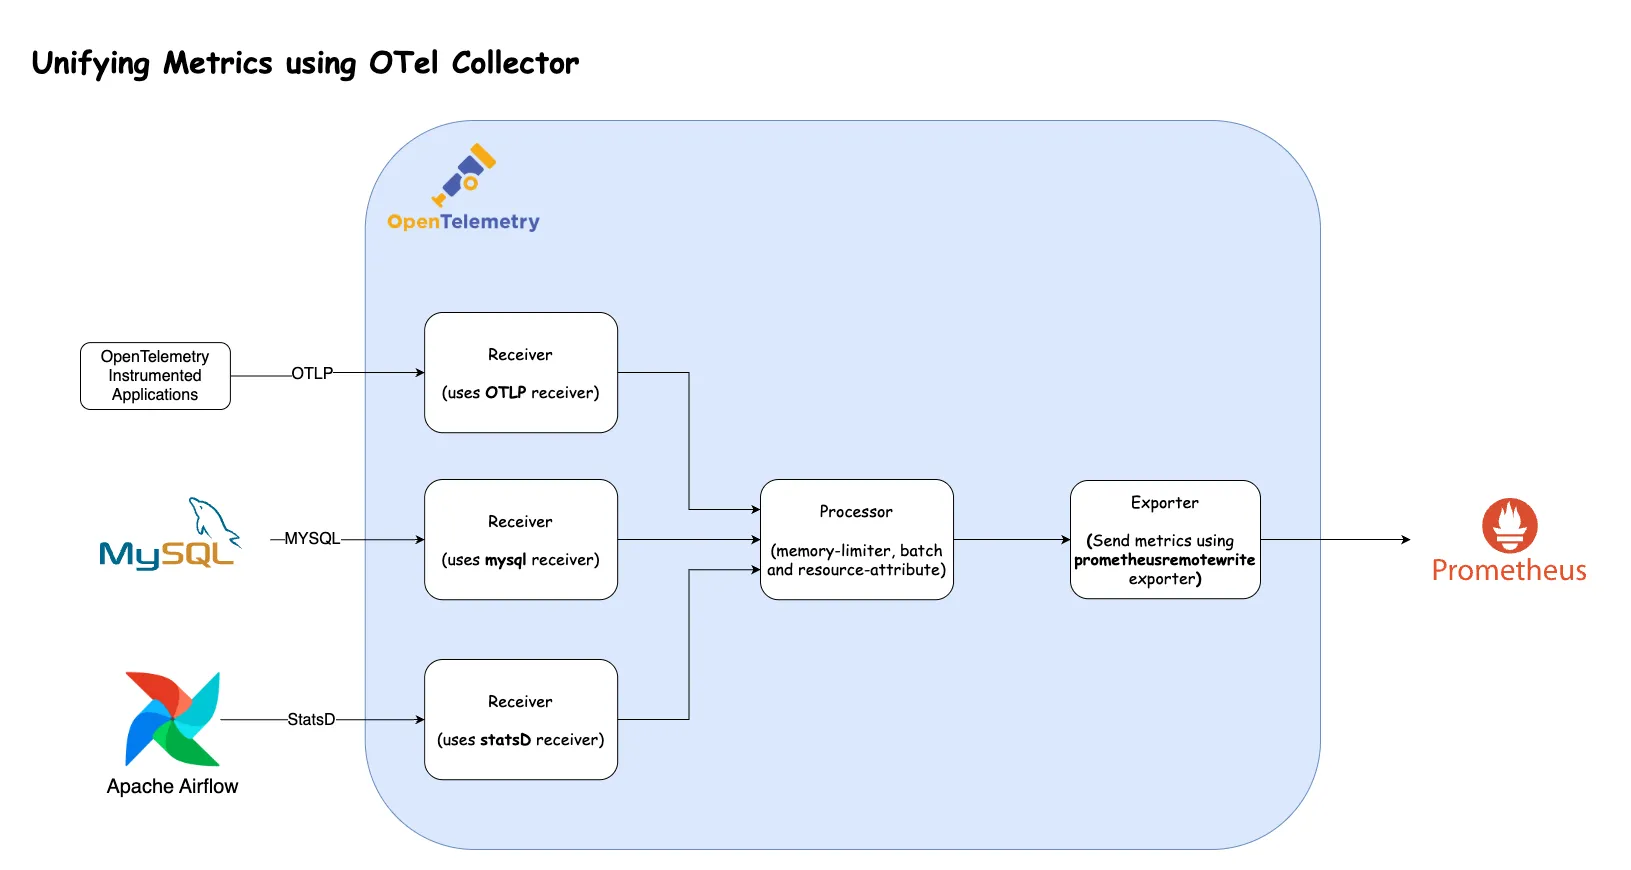
This diagram demonstrates how the OpenTelemetry Collector centralizes metric ingestion from diverse sources.
On the left are examples like modern applications sending OTLP, a MySQL database providing its specific metrics, and Apache Airflow emitting StatsD data. Each distinct data type flows into a corresponding specialized receiver within the OTel Collector (OTLP, MySQL and StatsD receivers, respectively).
These metrics are then funneled through common processors, which can normalize the data by adding consistent resource attributes (such as environment labels) and batching them for efficiency.
Finally, a single exporter, such as the prometheusremotewrite exporter used in this example, transmits these metrics to your central Prometheus instance, drastically simplifying the overall monitoring pipeline.
Let’s translate this into a working setup using Docker Compose.
Instructions For Configuring Fluent Bit:
1. Create your directory.
Open your terminal and create a directory called otel-test:
mkdir otel-test && cd otel-test
2. Create a Docker network using the below command.
docker network create opentelemetry-demo
3. Set up MySQL
Create a file called mysql.yml with the below content:
services:
  mysql:
    image: mysql:8.0
    container_name: mysql
    environment:
      MYSQL_ROOT_PASSWORD: rootpass
      MYSQL_USER: otel
      MYSQL_PASSWORD: otelpass
      MYSQL_DATABASE: otel
    ports:
      - "3306:3306"
    networks:
      - opentelemetry-demo

networks:
  opentelemetry-demo:
    external: true
4. Set up Airflow
Create a file called airflow.yml with the below content:
services:
  airflow:
    image: apache/airflow:2.8.1-python3.10
    container_name: airflow
    environment:
      - AIRFLOW__METRICS__STATSD_ON=True
      - AIRFLOW__METRICS__STATSD_HOST=otel-collector
      - AIRFLOW__METRICS__STATSD_PORT=8125
      - AIRFLOW__CORE__EXECUTOR=SequentialExecutor
      - AIRFLOW__CORE__LOAD_EXAMPLES=False
    command: bash -c "airflow db init && airflow standalone"
    networks:
      - opentelemetry-demo

networks:
  opentelemetry-demo:
    external: true
5. Set up OpenTelemetry Instrumented Applications
Execute the commands below in your terminal. It will create two files: .env and otel-demo.yml. This setup uses a stripped-down version of the [otel-demo] repository.
wget https://gist.githubusercontent.com/sharadregoti/6223a08ad3f52c7eee1b688aaff68c42/raw/d87e4dd0911bf0af45b33e9b3a0566d335d70efa/.env
https://gist.githubusercontent.com/sharadregoti/6223a08ad3f52c7eee1b688aaff68c42/raw/10b97b173ff3dc06a55824d504865f80cb6c3122/otel-demo.yml
6. Set up Prometheus:
Execute the below command to create the Prometheus configuration file under the directory prometheus
mkdir prometheus && cd prometheus && touch prometheus.yml
Copy the below content into the configuration file.
global:
  scrape_interval: 15s
  evaluation_interval: 15s

scrape_configs:
  - job_name: 'prometheus'
    static_configs:
      - targets: ['localhost:9090']
Create a file called prometheus-compose.yml with the below content:
services:
  prometheus:
    image: prom/prometheus:v2.53.4 # Use a recent version
    container_name: prometheus
    command:
      - '--config.file=/etc/prometheus/prometheus.yml'
      - '--web.enable-lifecycle' # Allows config reload
      - '--web.enable-remote-write-receiver' # Crucial for receiving remote write data
    volumes:
      - ./prometheus:/etc/prometheus
      - prometheus_data:/prometheus # Optional: Persist data
    ports:
      - "9090:9090"
    networks:
      - opentelemetry-demo

volumes:
  prometheus_data: {}

networks:
  opentelemetry-demo:
    external: true
7. Configure and Set Up Open Telemetry Collector
Execute the below command to create the OTEL configuration file under the directory otel-collector
mkdir otel-collector && cd otel-collector && touch otel-collector-config.yaml
Copy the below content into the configuration file.
receivers:
  # 1. OTLP Receiver (for gRPC and HTTP)
  otlp:
    protocols:
      grpc:
        endpoint: 0.0.0.0:4317
      http:
        endpoint: 0.0.0.0:4318

  # 2. Prometheus Receiver (to scrape existing exporters)
  prometheus:
    config:
      scrape_configs:
        - job_name: 'legacy-node-exporter'
          scrape_interval: 10s
          static_configs:
            - targets: ['node-exporter:9100']
          metric_relabel_configs:
            - source_labels: [__address__]
              target_label: collector_scraped_target

  # 3. StatsD Receiver
  statsd:
    endpoint: 0.0.0.0:8125 # Listen on UDP port 8125
    aggregation_interval: 10s # Aggregate stats over 10s before flushing

  mysql:
    endpoint: mysql:3306
    username: otel
    password: otelpass
    database: otel
    collection_interval: 10s
    initial_delay: 1s
    statement_events:
      digest_text_limit: 120
      time_limit: 24h
      limit: 250

processors:
  # Standard processors
  memory_limiter:
    check_interval: 1s
    limit_percentage: 75
    spike_limit_percentage: 25

  batch:
    send_batch_size: 8192
    timeout: 1s

  # Add common attributes/labels to all metrics passing through
  resource:
    attributes:
    - key: environment
      value: "development"
      action: insert # Add if not present
    - key: collector.instance.id
      value: "otel-collector-01"
      action: insert

exporters:
  # 1. Prometheus Remote Write Exporter
  # Pushes metrics TO Prometheus's remote write endpoint
  prometheusremotewrite:
    endpoint: "http://prometheus:9090/api/v1/write" # URL of Prometheus remote write endpoint
    resource_to_telemetry_conversion:
      enabled: true

service:
  pipelines:
    metrics:
      receivers: [otlp, prometheus, statsd, mysql]
      processors: [memory_limiter, resource, batch]
      exporters: [prometheusremotewrite]
Create a file called otel-collector.yml with the below content:
services:
  otel-collector:
    image: otel/opentelemetry-collector-contrib:0.123.0 # Use contrib for more receivers/exporters
    container_name: otel-collector
    command: ["--config=/etc/otelcol-contrib/otel-collector-config.yaml"]
    volumes:
      - ./otel-collector:/etc/otelcol-contrib
    ports:
      # Receivers
      - "4317:4317"    # OTLP gRPC receiver
      - "4318:4318"    # OTLP HTTP receiver
      - "8125:8125/udp" # StatsD receiver
      # Exporters
      - "8889:8889"    # Prometheus exporter (for Prometheus to scrape the collector)
      # Optional: Expose Collector's own metrics
      - "8888:8888"
    networks:
      - opentelemetry-demo

networks:
  opentelemetry-demo:
    external: true
8. Run all the services
Execute the command below.
docker compose \
		-f mysql.yml \
    -f airflow.yml \
    -f otel-demo.yml \
    -f prometheus-compose.yml \
    -f otel-collector.yml up -d
It will take a couple of minutes; please wait for the command to complete.
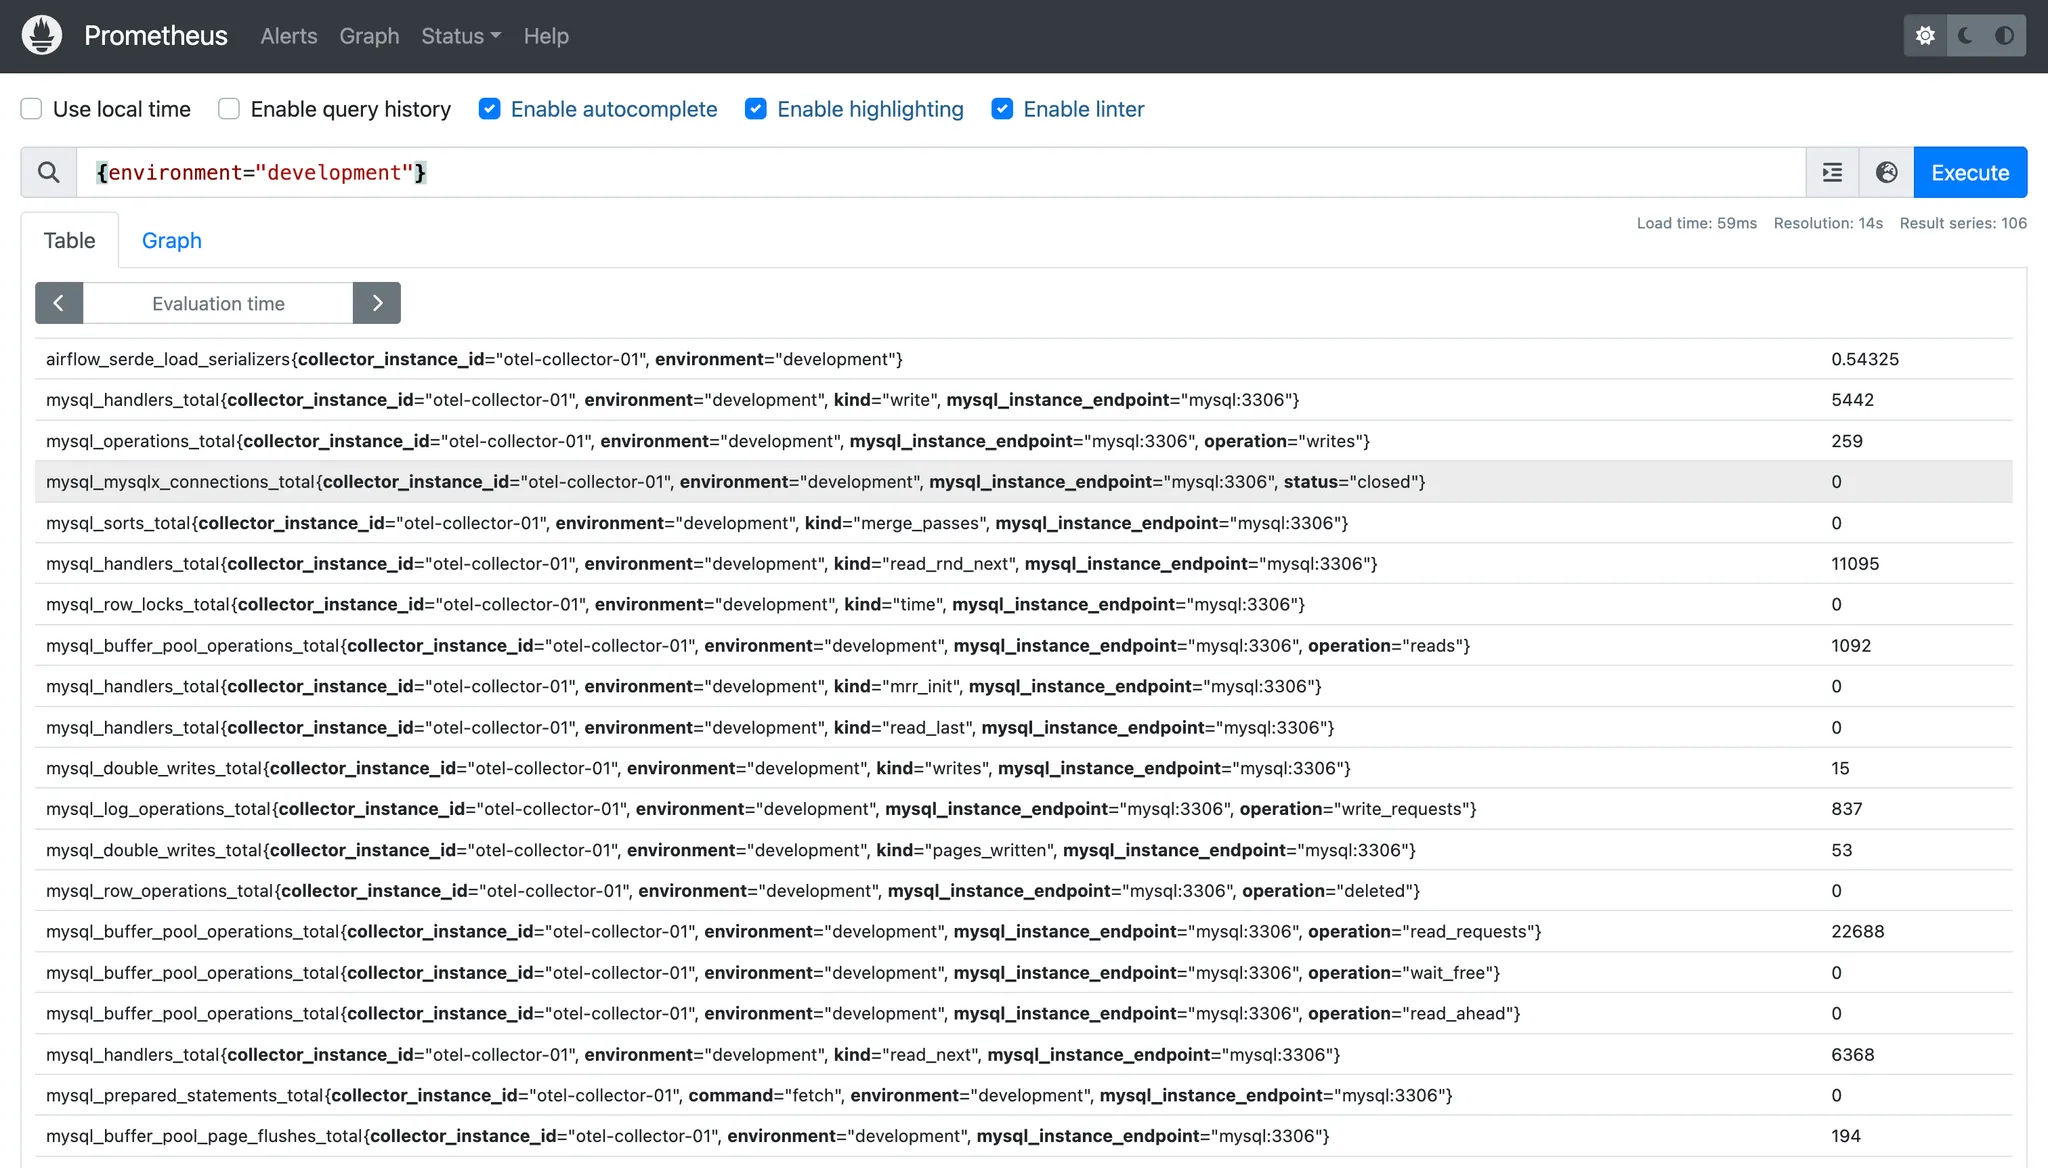
9. Observe the output in Prometheus
Open Prometheus in the browser using this URL: http://localhost:9090/graph, and run this command in the console.
{environment="development"}
You should see an output as shown in the image below.
To view more results, try the following Prometheus queries.
# To view "airflow" statsd metrics
airflow

# To view "mysql" metrics
mysql
10. Clean Up
Execute the below command to remove all containers.
docker compose \
		-f mysql.yml \
    -f airflow.yml \
    -f otel-demo.yml \
    -f prometheus-compose.yml \
    -f otel-collector.yml down && docker network rm opentelemetry-demo
Conclusion
The OpenTelemetry Collector helps manage metrics in heterogeneous environments. By acting as a central aggregation and processing layer, it allows you to:
- Simplify Prometheus configuration: Reduce the number of scrape targets and specialized exporters Prometheus needs to manage.
- Unify diverse metric sources: Ingest OTLP, Prometheus-formatted metrics and StatsD (among many other formats supported by receivers) through a single component.
- Ensure consistency: Apply standard labels and transformations using processors to ensure standardized metadata across all metrics.
- Provide flexibility: Choose between pushing metrics via Prometheus Remote Write or exposing a single, aggregated scrape endpoint for Prometheus to pull.
Whether you’re migrating applications to OpenTelemetry, integrating legacy systems or simply dealing with a complex mix of metric sources, the OTel Collector offers a robust solution to bridge the gaps in your observability stack.
This article originally appeared in The New Stack.
Whitepaper: Getting Started with
Fluent Bit and OSS Telemetry Pipelines
Getting Started with Fluent Bit and OSS Telemetry Pipelines: Learn how to navigate the complexities of telemetry pipelines with Fluent Bit.


