")

Why we need AI to accelerate operations
Developers now spend 57% of their time responding to incidents, according to a recent Cisco study. More than half of every workday is dedicated to firefighting instead of building.
And the problem’s getting worse. AI coding assistants are speeding up the pace at which teams ship code. More code reaches production faster than ever before. Which means more signals, more alerts, and more incidents to investigate.
But here’s the issue: while AI has accelerated development, it hasn’t accelerated operations. Troubleshooting is still manual and dependent on tribal knowledge. Each incident can feel like starting from scratch.
Today, we’re changing that with Chronosphere’s AI-Powered Guided Troubleshooting — a set of capabilities that use AI to guide your investigations step-by-step:
- Suggestions: Proactive insights that guide investigations, presented in plain language.
- Natural Language Queries: The ability to interact with your observability data in plain English.
- Temporal Knowledge Graph: A continuously updated map of your services, infrastructure, and their relationships—accounting for human input as well.
- Investigation Notebooks: A persistent workspace that captures every step, piece of evidence, and conclusion from your investigation—all of which are fed into the Knowledge Graph after.
We’ll dive into these features shortly. First, let’s explore the problem we’re solving.
The Problem with "AI root cause analysis"
If you’ve tried other AI troubleshooting tools, you might be skeptical. You should be.
Many AI-powered tools claim to automate root cause analysis. In demos, they look impressive—generating confident explanations that sound like root causes. But in production, they often send you down the wrong path.
The issue isn’t the AI itself. It’s the context these tools work with. Most observability platforms are built around standardized integrations—AWS services, Kubernetes clusters, PostgreSQL databases. But the data that matters most for troubleshooting—your custom application telemetry—often doesn’t fit these standard templates. Your business logic, service-specific metrics, and custom span attributes are where root causes actually hide. If your AI tool can only reason about standardized data, it’s operating with an incomplete picture.
Standalone AI SRE agents face a different limitation. While they can access raw observability data through protocols like Model Context Protocol (MCP), raw data isn’t the same as contextualized knowledge. Building a knowledge graph—the processed, normalized view that turns raw telemetry into meaningful relationships—requires an observability backend with tooling to clean and connect disparate data sources. Without this infrastructure, these agents can see your data but can’t understand how it relates or what patterns matter in your environment.
So what would it take for AI to actually help during incidents?
Two breakthroughs: Complete context + advanced analytics
Effective AI guidance requires two breakthroughs: a complete understanding of your system and sophisticated analytics that surface the right signals.
Complete data context through the Temporal Knowledge Graph
At the core of Chronosphere’s Guided Troubleshooting is the Temporal Knowledge Graph—a continuously updated map of your services, infrastructure, and their relationships. Our Knowledge Graph connects all telemetry types (metrics, traces, logs), infrastructure context, system changes, and human knowledge (comments, resolution notes, runbooks) captured over time.
Here’s the difference: Chronosphere’s Knowledge Graph normalizes custom and non-standard telemetry data. While competitors require data in standardized formats from known integrations, we can make sense of your unique application-level instrumentation—the custom metrics, span attributes, and log fields that are specific to your business logic.
Advanced analytics that surface the right signals
A complete data picture is necessary but not sufficient. You also need analytics sophisticated enough to separate signal from noise. For example:
- Differential Diagnosis (DDx) compares behavior during an incident against baseline periods to identify what changed.
- Leaf Errors trace error propagation through your service graph to find where failures originated, not just where they surfaced.
- Related Alerts identify which alerts are likely symptoms of the same root cause versus independent incidents
These analytics run automatically during investigations, surfacing the most relevant correlations and ruling out red herrings. We’re not just prompting an LLM with raw data—we’re feeding it pre-analyzed insights that focus attention on the most probable causes.
These two capabilities—complete context and advanced analytics—come together in three integrated features.
A new investigation experience
Your checkout service starts throwing 500 errors at 2 AM. Historically, you’d spend 20 minutes scanning dashboards, correlating metrics, and hunting through logs. Here’s what happens with Chronosphere’s Guided Troubleshooting instead.
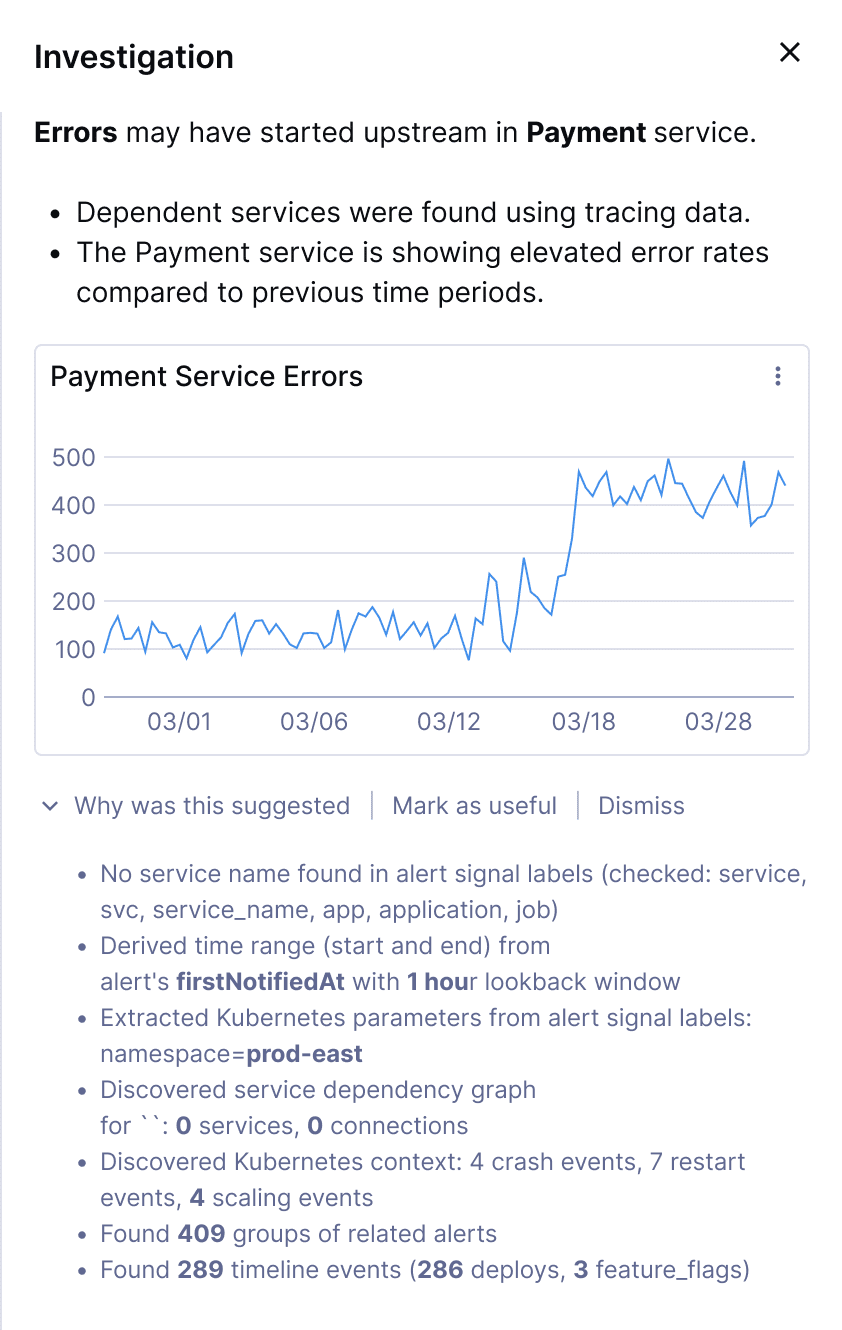
Suggestions surface the most likely causes
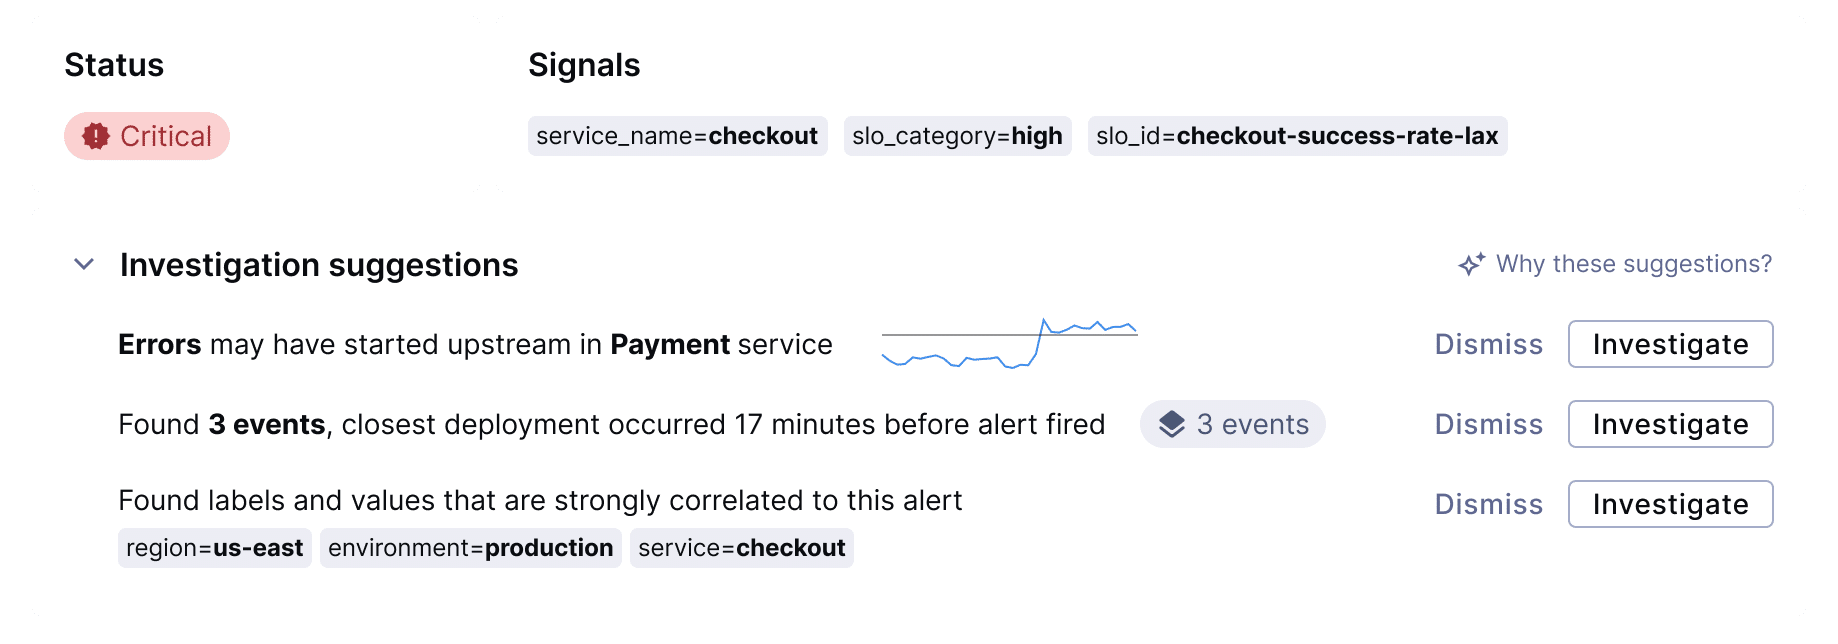
Within seconds of opening the alert, Suggestions—evidence-backed insights that guide your investigation—automatically appear: “Errors started in the upstream payment-processor service 3 minutes before appearing in the checkout service.” You didn’t run any queries—Chronosphere already aggregated analysis from metrics, traces, logs, and infrastructure context to surface this correlation.
Each Suggestion includes the specific evidence behind it: the error patterns, the timing correlation, the service dependencies. You can validate the finding immediately and decide whether to investigate further or dismiss it.
Suggestions don’t claim to have found the root cause. They show you the most probable next step, explain their reasoning, and let you decide. The AI guides; you remain in control.
Investigation Notebooks capture your path
As you drill into the payment-processor service, check related metrics, and examine trace spans, Investigation Notebooks automatically records every step. At each point in your investigation, Chronosphere reruns its analysis patterns, continually narrowing the scope based on what you’ve already ruled out.
Once you’ve identified the root cause—say, a database connection pool exhaustion triggered by a recent config change—that outcome feeds back into the Temporal Knowledge Graph. The next time a similar pattern emerges, Suggestions will be smarter because the system learned from your investigation.
You can save the Notebook and share it with your team. New engineers can see exactly how you approached this incident. It becomes a dynamic runbook that lives in the system, not buried in a Slack thread.
Natural Language Assistance speeds up queries
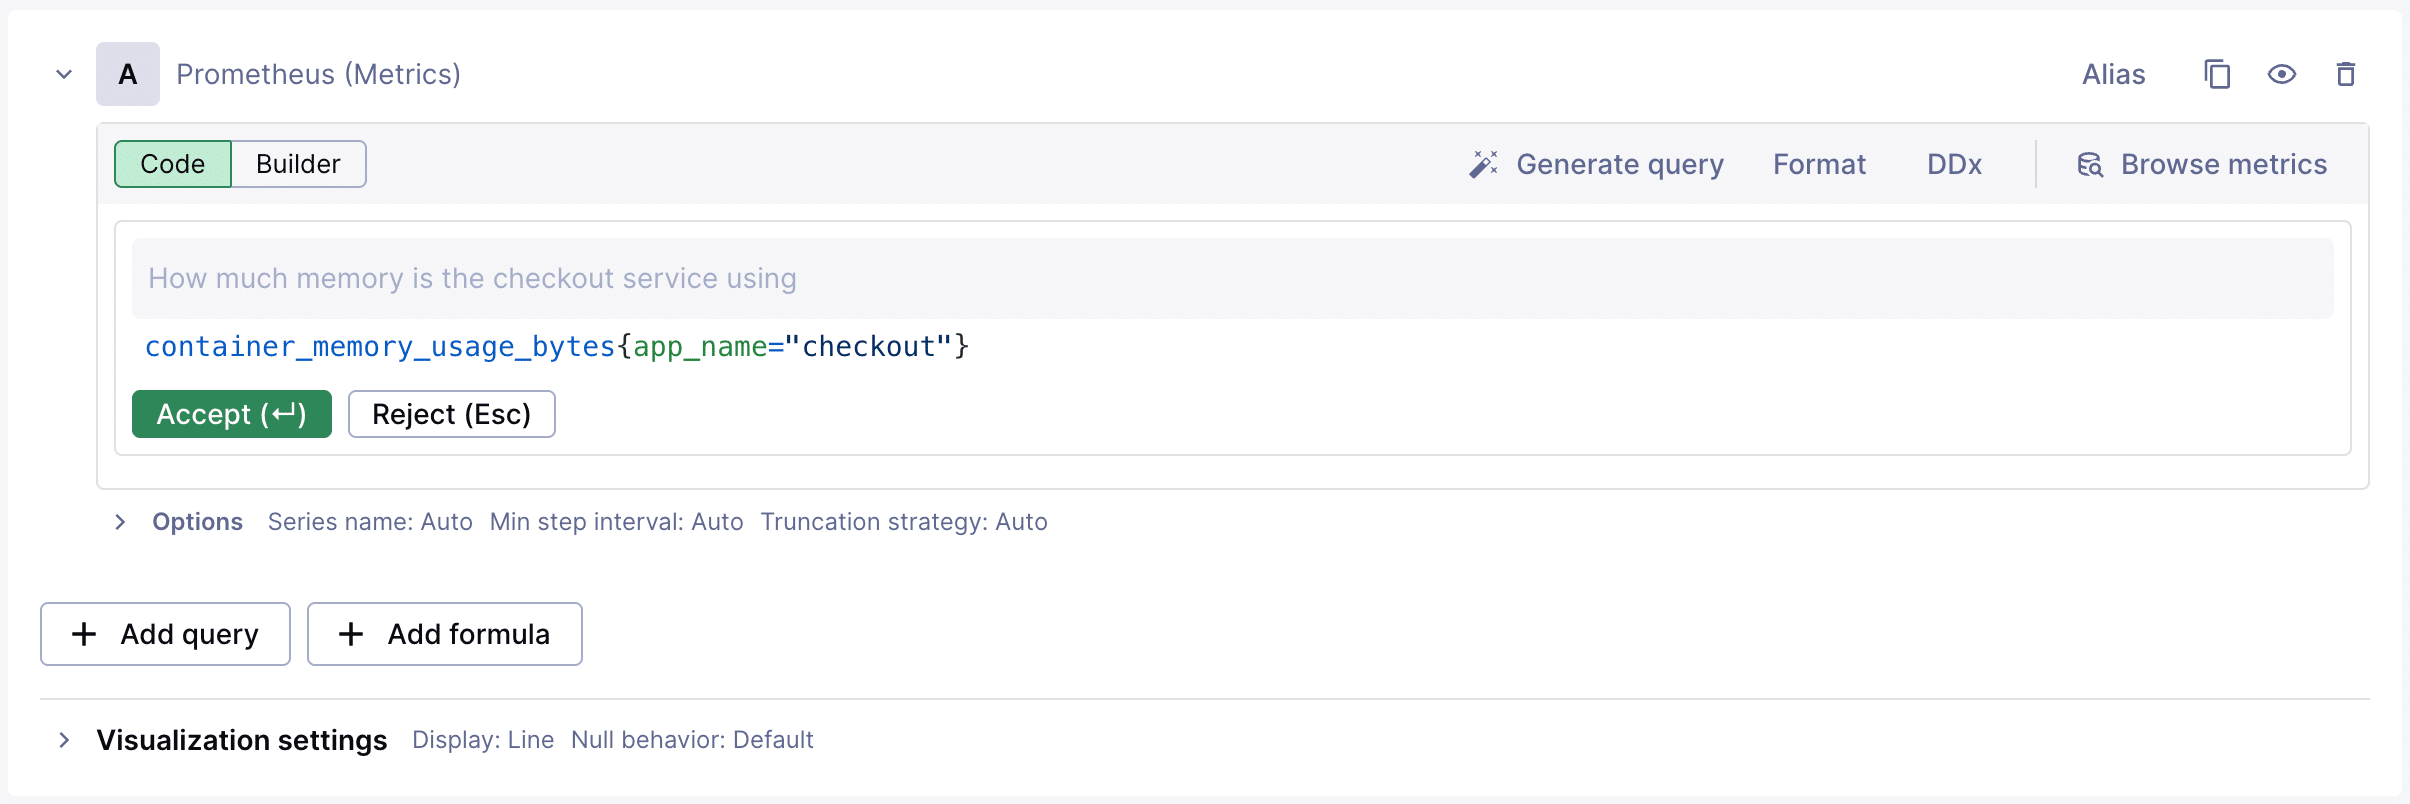
Throughout the investigation, you need to check metrics you don’t query regularly. Instead of looking up PromQL syntax or searching for the exact metric name, you ask: “Show me database connection pool usage for payment-processor over the last hour.” Chronosphere generates the query. You refine it: “break that down by replica.” The query updates. You keep moving.
This integrated approach delivers tangible outcomes:
- Shorter Mean Time to Resolution. Suggestions cut through the noise by surfacing ranked, evidence-backed hypotheses, letting engineers move directly to validation and remediation.
- Reduced On-Call Stress. You never start from scratch—whether it’s your first week on-call or you’re investigating an unfamiliar service, Suggestions provide a clear starting point and Investigation Notebooks show how similar incidents were resolved previously.
- Growing Institutional Knowledge. Every investigation strengthens your observability system as Notebook outcomes feed the Temporal Knowledge Graph. This makes future Suggestions more accurate and turns troubleshooting patterns that used to exist only in senior engineers’ heads into codified knowledge the entire team can access.
Ready to troubleshoot smarter?
The troubleshooting gap is over. With Chronosphere’s Guided Troubleshooting, you resolve incidents based on actual system context, not guesswork:
- Resolve incidents faster with AI-guided, evidence-backed Suggestions that surface probable root causes immediately.
- Eliminate blind spots caused by incomplete context—see your entire stack, including custom application telemetry.
- Build institutional knowledge that makes your team stronger over time as each investigation improves future guidance.
Chronosphere’s Guided Troubleshooting features are currently available in Limited Availability. Book time with our team to see them in action and learn how they can accelerate your team’s incident response.
O’Reilly eBook: Cloud Native Observability
Master cloud native observability. Download O’Reilly’s Cloud Native Observability eBook now!