")

Introduction
Fluent Bit is a widely used open source data collection agent, processor, and forwarder that enables you to collect logs, metrics and traces from various sources, filter and transform them, and then forward them to multiple destinations.
In modern infrastructure, despite the rise of structured JSON logging, Syslog remains a standard for networking equipment, legacy applications, and Linux distributions. However, analyzing Syslog files locally on each server is not practical.
In this guide, we will set up Fluent Bit as a centralized Syslog server that accepts logs over UDP (User Datagram Protocol) and ships them directly to Elasticsearch for analysis.
Prerequisites
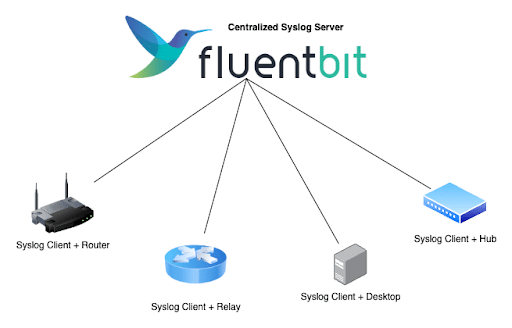
Centralized Syslog server using Fluent Bit
-
- Docker and Docker Compose: Installed on your system.
- Elasticsearch: We will send logs to an Elasticsearch instance. To follow along, you should have an instance running. You can refer to this guide to run it locally.
- Familiarity with Fluent Bit concepts: Such as inputs, outputs and buffers. If you’re unfamiliar with these concepts, please refer to the official documentation.
What is Syslog?
Syslog is a standard for message logging. It allows separation of the software that generates messages, the system that stores them, and the software that reports and analyzes them.
Syslog messages generally travel over UDP port 514 (or 5140 in non-root environments). Because it is a “fire and forget” protocol, it is fast and lightweight, making it ideal for high-volume logging from routers, firewalls and lightweight Linux containers. However, raw Syslog text can be hard to query. By using Fluent Bit, we can ingest these messages, structure them and store them in a search engine like Elasticsearch.
To know more about Syslog, you can refer to the Syslog Wikipedia page.
Our use case
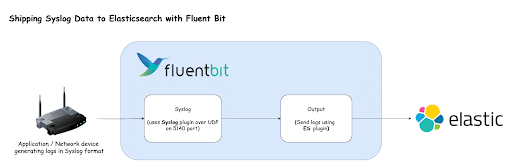
How to ship Syslog data to Elasticsearch using Fluent Bit
In this demo, we will create a simulation environment using Docker Compose:
- Fluent Bit: Configured to listen on UDP Port 5140 for Syslog traffic.
- Alpine loggers: Two separate Alpine Linux containers that will act as “network devices.” They will generate log messages every 10 seconds using the `logger` command and send them to our Fluent Bit container.
- Elasticsearch: The destination where our logs will be stored and indexed.
Instructions
1. Create a Project Directory
First, create a directory to hold your configuration and Docker Compose files.
mkdir fluent-bit-syslog-demo
cd fluent-bit-syslog-demo
2. Create Fluent Bit configuration
Create a directory named `fluent-bit/config` and inside it, create a file named `fluent-bit.yaml` with the following content:
service:
  flush: 1
  log_level: info
  parsers_file: parsers.conf

pipeline:

  inputs:
    - name: syslog
      mode: udp
      listen: 0.0.0.0
      port: 5140

  outputs:
    - name: es
      match: '*'
      # CHANGE THESE TO MATCH YOUR ELASTICSEARCH SETUP
      host: 192.168.1.5
      port: 9200
      index: syslog-data
      http_user: elastic
      http_passwd: rslglTS4
      suppress_type_name: 'On'
This file tells Fluent Bit to listen for Syslog messages and forward them to your Elasticsearch instance.
NOTE: Update the `host, http_user`, and `http_passwd` in the output section to match your actual Elasticsearch credentials.
3. Create Docker Compose file
Create a file named `docker-compose.yaml` with the following content:
services:
  fluent-bit:
    image: 'fluent/fluent-bit:latest'
    container_name: fluent-bit
    ports:
      - '6000:5140/udp'
      - '24224:24224'
    volumes:
      - './fluent-bit/config/fluent-bit.yaml:/fluent-bit/etc/fluent-bit.yaml'
    networks:
      - syslog-test
    restart: unless-stopped
    command: '-c /fluent-bit/etc/fluent-bit.yaml'
  alpine-logger-1:
    image: 'alpine:latest'
    container_name: alpine-logger-1
    depends_on:
      - fluent-bit
    networks:
      - syslog-test
    command: |
      /bin/sh -c " apk add --no-cache util-linux && while true; do
        logger -n fluent-bit -P 5140 -t alpine-test \"This is a test message from Alpine Logger 1 at \$(date)\"
        sleep 10
      done "
  alpine-logger-2:
    image: 'alpine:latest'
    container_name: alpine-logger-2
    depends_on:
      - fluent-bit
    networks:
      - syslog-test
    command: |
      /bin/sh -c " apk add --no-cache util-linux && while true; do
        logger -n fluent-bit -P 5140 -t alpine-test \"This is a test message from Alpine Logger 2 at \$(date)\"
        sleep 10
      done "
networks:
  syslog-test:
    driver: bridge
This file defines our Fluent Bit service and the two Alpine containers generating traffic. The Alpine container uses the logger CLI to create logs in the Syslog format.
4. Run the container
docker compose up -dOnce the containers are running, the Alpine instances will immediately start sending logs to Fluent Bit, which forwards them to Elasticsearch.
5. Verify logs in Elasticsearch
`syslog-data*`. To view these logs in Kibana, you need to create a Data View.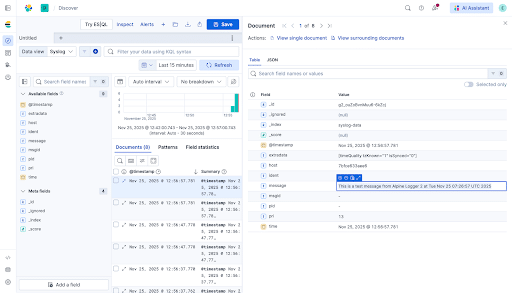
Creating a Data View in Kibana
6. Clean up
docker compose down -v
Conclusion
In this guide, we successfully set up a lightweight Syslog collector using Fluent Bit. We simulated a real-world environment where multiple servers send logs to a central point via UDP. Fluent Bit collected these logs and shipped them to Elasticsearch for storage and analysis.
Manning Book: Fluent Bit with Kubernetes
Learn how to optimize observability systems for Kubernetes. Download Fluent Bit with Kubernetes now!