How It Works
DDx for Metrics Changes the Game for Metric-Based Troubleshooting
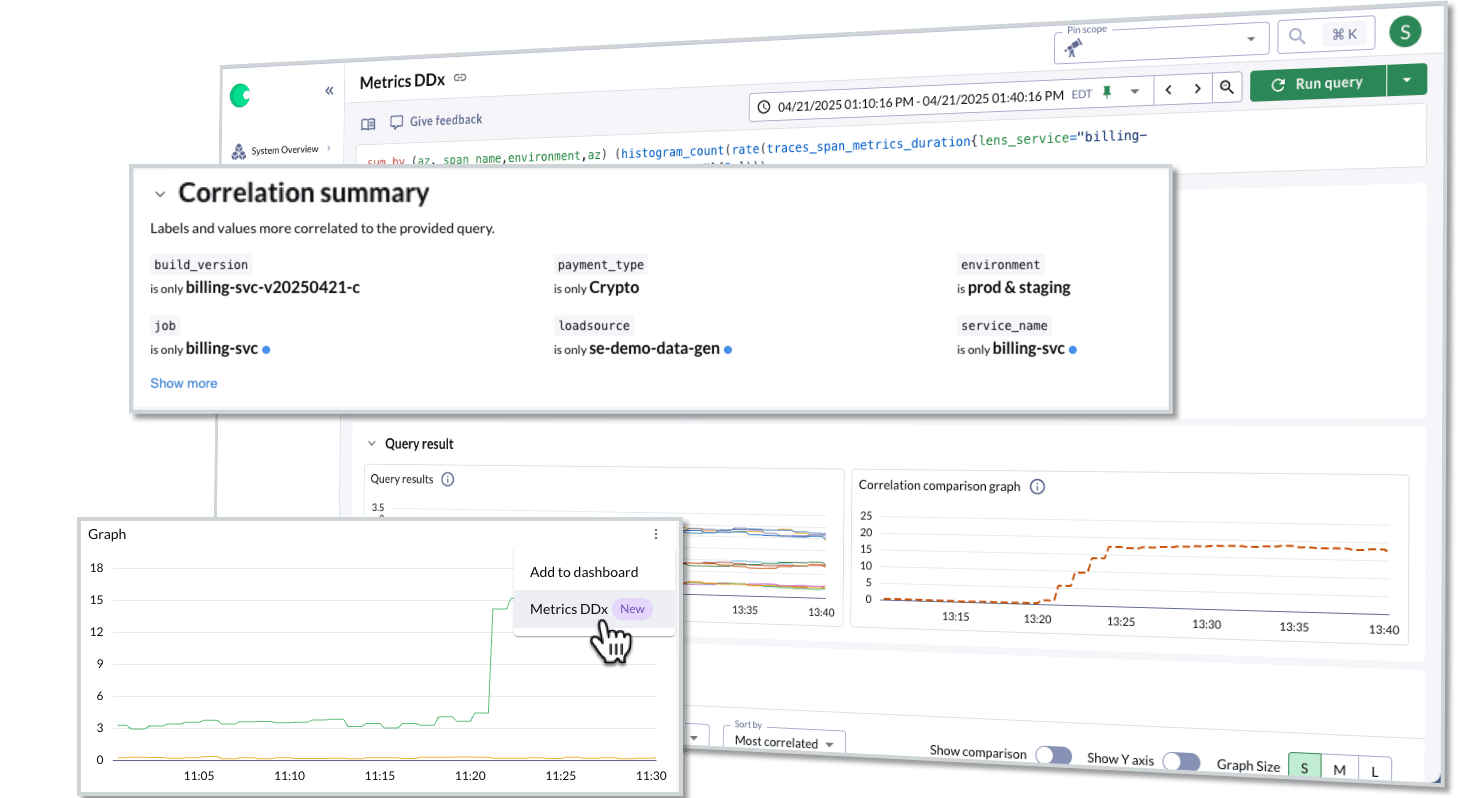
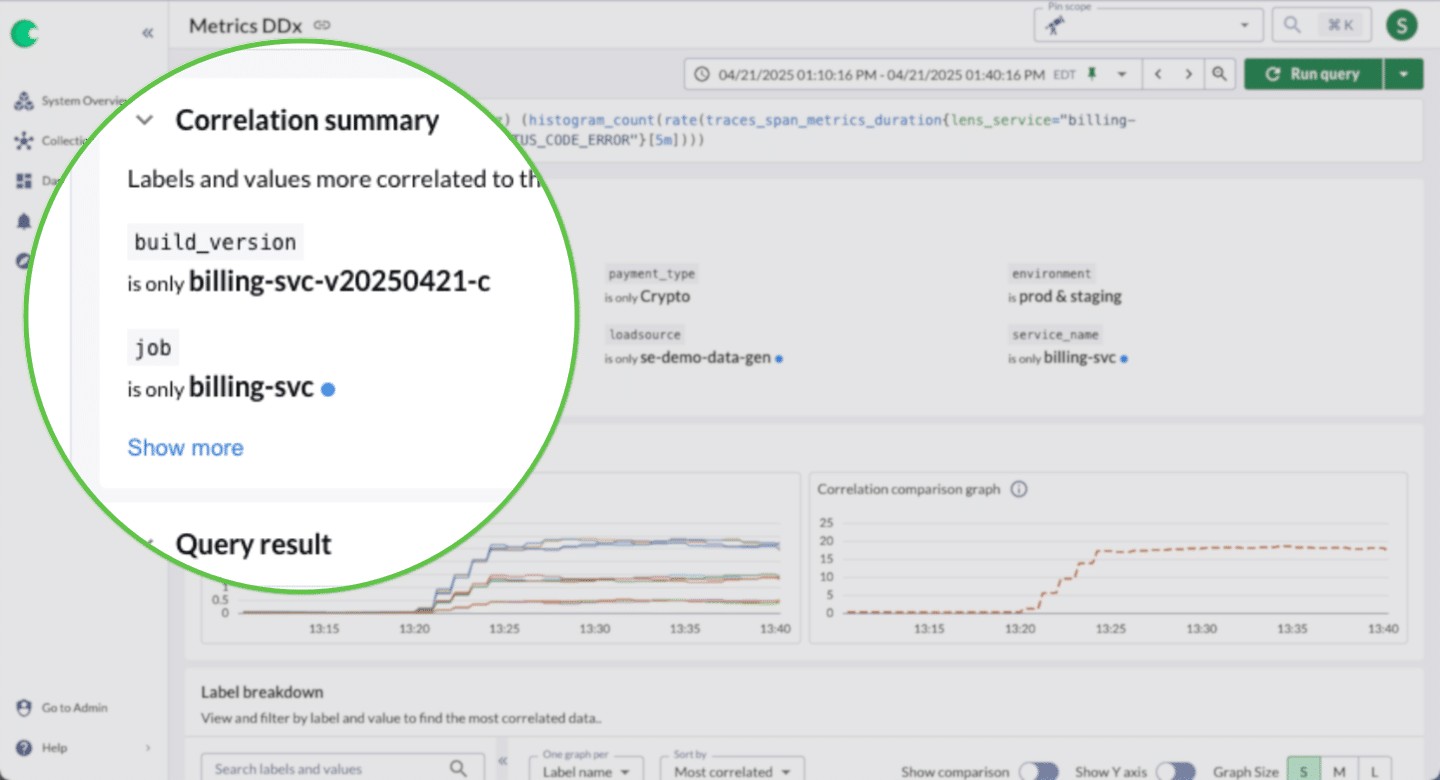
Instead of guessing which dimension might explain an anomaly, DDx for Metrics does the hard part for you. It automatically analyzes every available dimension in your metric data and tells you what changed, and just as importantly, what didn’t. No switching tools. No writing PromQL. No relying on someone who “knows the system and the data.”
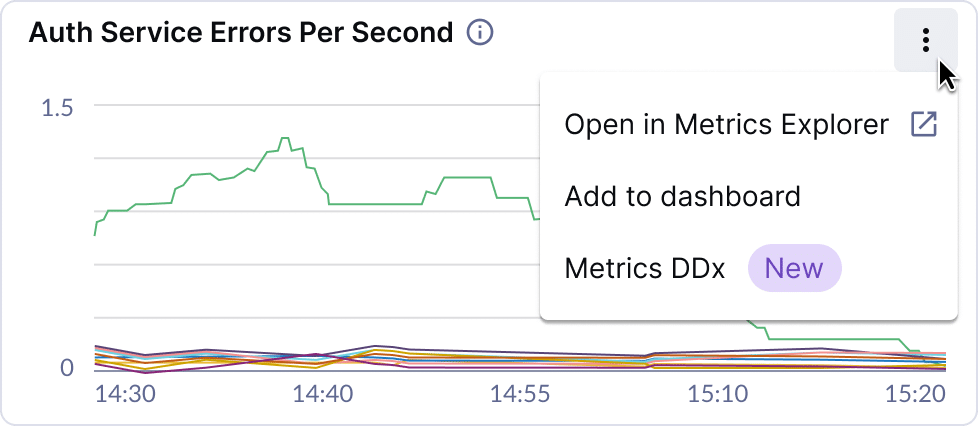
See Something Odd? DDx it!
Instantly understand what changed - and what didn’t - with automated correlation analysis across all metric dimensions. Launch DDx directly from any Chronosphere chart.
Less Guesswork, More Answers
DDx for Metrics helps guide you through your hypothesis testing with smart correlation insights, cutting out the guesswork and speeding up every investigation to get to the root cause faster.
Uncover Hidden Dimensions - Like Magic
Reveal hidden dimensions in simplified metrics like Recording Rules using X-Ray. Dimensions that may hold the answers you need to get to the root cause of performance issues.
Focus on Core Signals. DDx Handles the Deep Dives
Stop overloading your charts and alerts! More is not better. More is brittle and noisy. Use just enough to see the symptoms of the problem. All the dimension you need (including the ones you don’t know about) are one click away with DDx.
Key Features
Whenever you see a metric anomaly in Chronosphere, you can use DDx - no need to jump to another tool or preconfigure anything. “See it, DDx it, Understand it.”


