You may have seen the recent news that Chronosphere was named a Leader in the 2024 Gartner® Magic Quadrant™ for Observability Platforms. But are you familiar with the evaluation criteria that determines where a solution places on the Magic Quadrant? In this blog I’ll break it all down for you, and help decode the Magic Quadrant.
How Gartner defines Observability Platforms
If you’ve been paying close attention, you may have noticed that the name of this report shifted slightly over the past few years. In 2022, the long-running report previously called “Magic Quadrant for Application Performance Monitoring” was updated with the term “Observability.” However in 2024, the report has evolved again, dropping the term Application Performance Monitoring and now simply using “Observability Platforms.” But how does Gartner define an Observability Platform? Here’s an excerpt from the definition in the report:
“Gartner defines observability platforms as products that ingest telemetry (operational data) from a variety of sources including, but not limited to, logs, metrics, events and traces. They are used to understand the health, performance and behavior of applications, services and infrastructure. Observability platforms enable an analysis of the telemetry, either via human operator or machine intelligence, to determine changes in system behavior that impact end-user experience such as outages or performance degradation. This allows for early, and even preemptive, problem remediation. Observability solutions are used by IT operations, site reliability engineers, cloud and platform teams, application developers, and product owners.”
“At a minimum, observability platforms must:
- Ingest, store and analyze operational telemetry feeds, including (but not limited to) metrics, event, log and trace data.
- Identify and analyze changes in application, service or infrastructure behavior in order to determine availability outages, performance degradation and/or impact on end-user experience.
- Enrich telemetry by providing contextualization in the form of both topological dependency mapping and the relationship with and between business services.”
Source: Gartner, Magic Quadrant for Observability Platforms, Gregg Siegfried, Padraig Byrne, Mrudula Bangera, Matt Crossley, 12 August 2024.
Which vendors are included in the 2024 Gartner® Magic Quadrant™ for Observability Platforms?
Fun fact: According to Gartner, the “Magic Quadrant research identifies and then analyzes the most relevant providers and their products in a market. Gartner uses, by default, an upper limit of 20 providers to support the identification of the most relevant providers in a market. The inclusion criteria represent the specific attributes that analysts believe are necessary for inclusion in this research.” The list of evaluated vendors this year included one new entrant to the evaluation – Chronosphere.
In the 2024 Gartner® Magic Quadrant™ for Observability Platforms, the inclusion criteria crossed three areas: market participation, capabilities, and performance threshold achievement.
Market participation inclusion criteria
- “Provide generally available capabilities as of 14 March 2024. General availability means the product or service is widely available to all customers for purchase through normal sales channels.
- Sell the observability platform solution directly to paying customers without requiring them to engage professional services help. The vendor must provide at least first-line support for these capabilities, including any bundled open-source software. This includes, but is not limited to, comprehensive product documentation, installation guidance and reference examples.
- Demonstrate an active product roadmap, as well as go-to-market and selling strategies for their solutions.
- Have phone, email and/or web customer support. They must offer contract, console/portal, technical documentation and customer support in English (either as the product’s default language or as an optional localization).”
Capabilities inclusion criteria
- Observability platform offerings must offer native support for all mandatory capabilities and a majority of the common capabilities described in Gartner’s Market Definition.
- Observability platform offerings must be delivered via SaaS. Vendors may also provide self-hosted alternatives for clients that require them, but the self-hosted options are outside the scope of this research.”
Performance Threshold Achievement
- “The observability platform offering must have at least 50 paying, production (non-beta-test) customers in at least each of two or more geographic regions (Asia/Pacific, EMEA, Latin America or North America) excluding sales to (MSPs).
- The observability platform offering must have generated at least $75 million in annual generally accepted accounting principles (GAAP) revenue during the 12 calendar months prior to its receipt of Gartner’s Magic Quadrant welcome packet.
OR
- The observability platform offering must have generated a minimum of $10 million in annual revenue, combined with a growth rate of at least 25% in the 12 calendar months prior to the receipt of this letter, compared to its previously completed 12-month period.”
“In addition, the vendor must rank among the top organizations using the Customer Interest Indicator (CII) defined by Gartner for this Magic Quadrant. CII was calculated using a weighted mix of internal and external inputs that reflect Gartner client interest, vendor-customer engagement and vendor-customer sentiment.”
Source: Gartner, Magic Quadrant for Observability Platforms, Gregg Siegfried, Padraig Byrne, Mrudula Bangera, Matt Crossley, 12 August 2024.
The axes of the Gartner® Magic Quadrant™ defined
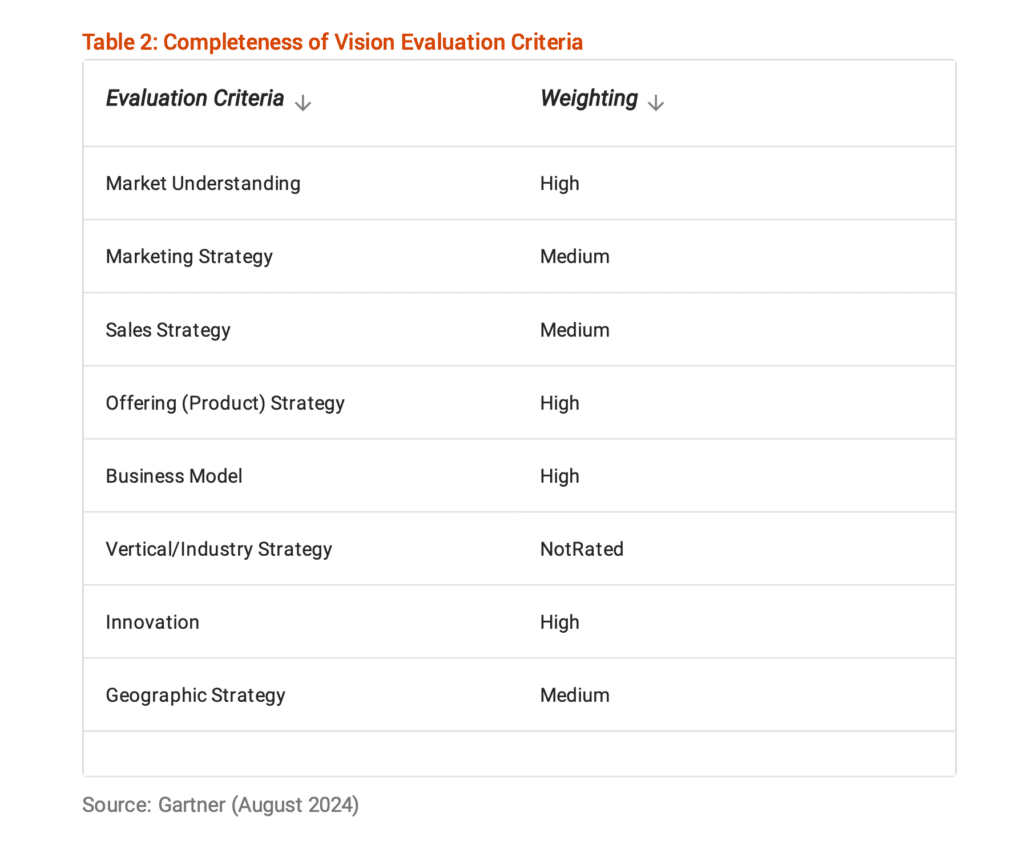
Gartner analysts “evaluate vendors on their ability to understand current market opportunities and create and articulate their vision for future market direction, innovation, customer requirements and competitive forces. Ultimately, vendors are rated on their vision for the future, and how well that maps to Gartner’s position.”
- Market Understanding
- Marketing Strategy
- Sales Strategy
- Offering (Product) Strategy
- Business Model
- Vertical/Industry Strategy
- Innovation
- Geographic Strategy
The Completeness of Vision criteria used in this Magic Quadrant are listed in Table 2.
Ability to Execute
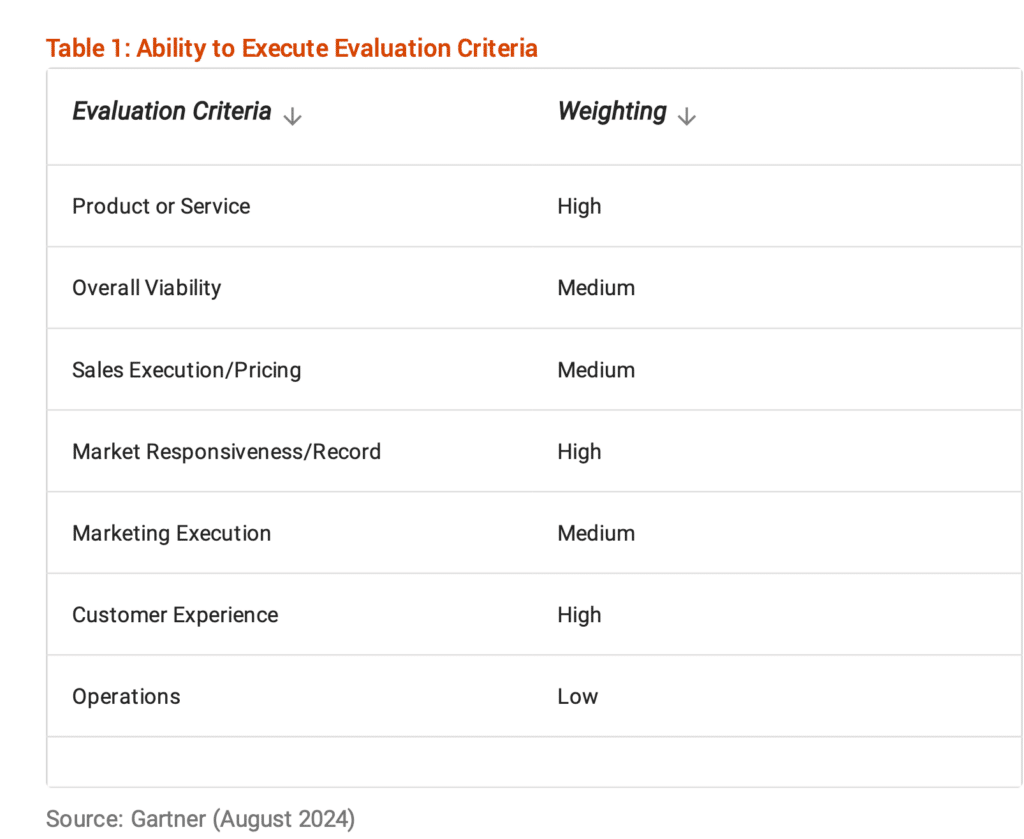
Gartner analysts “evaluate vendors on the quality and efficacy of the processes, systems, methods or procedures that enable provider performance to be competitive, efficient and effective, and to positively impact revenue, retention and reputation. Ultimately, vendors are judged on their ability and success in capitalizing on their vision.”
- Product
- Overall Viability
- Sales Execution/Pricing
- Market Responsiveness
- Marketing Execution
- Customer Experience
- Operations
The Ability to Execute criteria used in this Magic Quadrant are listed in Table 1.
Which vendors are recognized in the 2024 Gartner® Magic Quadrant™ for Observability Platforms?
A Magic Quadrant provides a graphical competitive positioning of four types of technology providers, in markets where growth is high and provider differentiation is distinct:
- Leader: Executes comparatively well against their current vision and are well positioned for tomorrow.
- Visionary: Understands where the market is going or has a vision for changing market rules, but does not yet execute well.
- Challenger: executes well today or may dominate a large segment, but do not demonstrate an understanding of market direction.
- Niche Player: Focuses comparatively successfully on a small segment, or is unfocused and does not out-innovate or outperform others.
In the 2024 Gartner® Magic Quadrant™ for Observability Platforms, Chronosphere was named a Leader. We are proud of this recognition, but more importantly, we think so do our customers – as of August 13, 2024, 91% of reviewers recommend Chronosphere on Gartner Peer Insights™.
Hidden features in the 2024 Gartner® Magic Quadrant™ for Observability Platforms
Gartner’s interactive Magic Quadrant features enable you to create a view of the Magic Quadrant to reflect your own business goals, needs and priorities. Most significantly the interactive features enable you to adjust the weightings applied to each of the evaluation criteria to generate a new, client-specific Magic Quadrant graphic for that market. You can then save and share these customized Magic Quadrants for your internal analyses and decision making.
Gartner’s interactive Magic Quadrant also brings together our expert opinion and the Peer Insights user-contributed reviews into one experience. The User Review tab enables you to read and evaluate what your peers have to say about the enterprise IT solutions they have implemented and use in their enterprise on a daily basis.
Go read the report already!
If you’ve gotten this far and you still haven’t read the report, go do that now! And let me know what other questions you have about the Magic Quadrant that I can answer for you.
Gartner, Magic Quadrant for Observability Platforms, Gregg Siegfried, Padraig Byrne, Mrudula Bangera, Matt Crossley, 12 August 2024.
—
Gartner does not endorse any vendor, product or service depicted in our research publications, and does not advise technology users to select only those vendors with the highest ratings or other designation. Gartner research publications consist of the opinions of Gartner’s research organization and should not be construed as statements of fact. Gartner disclaims all warranties, expressed or implied, with respect to this research, including any warranties of merchantability or fitness for a particular purpose.
GARTNER is a registered trademark and service mark of Gartner and Magic Quadrant is a registered trademark of Gartner, Inc. and/or its affiliates in the U.S. and internationally and are used herein with permission. All rights reserved.
This graphic was published by Gartner, Inc. as part of a larger research document and should be evaluated in the context of the entire document. The Gartner document is available upon request from Chronosphere.


