")


Instrumenting metrics in Java
Are you interested in joining the cloud native world and wondering what cloud native observability means for you?
Did you always want to know more about instrumentation, metrics, and your options for coding with open standards?
Are you a Java developer and looking for a working example to get started instrumenting your applications and services?
Look no further, as this article provides you with an easy to understand guide to instrumenting your Java using open standards.
In this article you’ll learn what open source metrics are, the projects used to collect them, about the libraries available to you as a Java developer for metrics instrumentation, apply instrumentation creating a fully working example in Java for the main four metrics types, and finally, setup metrics collection to explore your Java metrics in real-time.
Let’s start with some background and explore your options for open source metrics projects.
Open source metrics
There are many reasons that should lead you to the projects in the Cloud Native Computing Foundation (CNCF) when you are investigating cloud native observability. When you are investigating how you are going to integrate metrics instrumentation with your Java applications and services, you quickly land on the Prometheus project.
There has been a lot written about why Prometheus is a great fit for cloud native observability as many consider it the de facto standard of metrics instrumentation, transportation, collection, and querying. There is a wide adoption of this project and it’s protocols as to consider it an industry standard with a vibrant community of exporters, natively instrumented projects, and client libraries (as of the time of this writing):
- 960+ exporters (agents exposing Prometheus metrics)
- 50+ natively instrumented projects
- 20+ instrumentation client libraries
It’s one of those instrumentation client libraries that we will be exploring on our journey to instrumenting our Java applications and services.
Java client library
Java being a popular and much used language over the years in many organizations, it is nice to find that we have a Java client library for instrumentation as part of the Prometheus metrics project ecosystem. This library recently reached the version 1.0.0 status and was a good reason for me to update my example Prometheus Java Metrics Demo project that was used for an instrumentation lab in my Prometheus free online workshop.
Looking at the documentation we can jump to the getting started section where you find a menu entry for metric types. This section outlines the types of metrics that this library implements and talks about how it’s based on OpenMetrics, currently a CNCF sandbox project. The metrics it’s supporting are:
- Counter: The most common metric type. Counters only increase, never decrease.
- Gauge: For current measurements, such as the current temperature in Celsius.
- Histogram: For observing distributions, like latency distributions for services.
- Summary: Also for observing distributions, but summaries maintain quantiles.
- Info
- StateSet
- GaugeHistogram
In this article we’ll focus on the top four metrics, as the last three are seldom used, based on edge cases, and are not officially part of the Prometheus core metrics API.
Instrumenting Java example
To explore how you instrument a Java application or service you want to get hands-on example code, right? Well, I’m the same way so here’s a project I put together that is basically a sample Java application or service with the top four Java client library supported metrics implemented.
The easiest way to get started with my Prometheus Java Metrics Demo is to either clone it or download one of the formats provided and unpack it. The readme file provides all the instructions you need to install it, but let’s first look at the basic outline of the project.
- Download and unzip project.
- Import into your favorite IDE for Java development (I’m using VSCode)
There are a few important files in this project for you to focus on; pom.xml, BasicJavaMetrics.java, and the Buildfile.
Dependencies
If you explore the pom.xml file, you’ll see the dependencies on the Java client are sorted out for you.
 <dependencies>

    <dependency>

      <groupId>io.prometheus</groupId>

      <artifactId>prometheus-metrics-core</artifactId>

      <version>1.0.0</version>

    </dependency>

    <dependency>

      <groupId>io.prometheus</groupId>

      <artifactId>prometheus-metrics-instrumentation-jvm</artifactId>

      <version>1.0.0</version>

    </dependency>

    <dependency>

      <groupId>io.prometheus</groupId>

      <artifactId>prometheus-metrics-exporter-httpserver</artifactId>

      <version>1.0.0</version>

    </dependency>

    <dependency>

      <groupId>org.eclipse.jetty</groupId>

      <artifactId>jetty-servlet</artifactId>

      <version>9.4.15.v20190215</version>

    </dependency>

  </dependencies>
If you build this project you are going to get a jar file from the BasicJavaMetrics.java file.
 <!-- Build a full jar with dependencies -->

      <plugin>

        <artifactId>maven-assembly-plugin</artifactId>

        <configuration>

          <archive>

            <manifest>

              <mainClass>io.chronosphere.java_apps.BasicJavaMetrics</mainClass>

            </manifest>

          </archive>

          <descriptorRefs>

            <descriptorRef>jar-with-dependencies</descriptorRef>

          </descriptorRefs>

        </configuration>

        <executions>

          <execution>

            <id>make-assembly</id>

            <phase>package</phase>

            <goals>

              <goal>single</goal>

            </goals>

          </execution>

        </executions>

      </plugin>
This single class file, BasicJavaMetrics.java is used in this project to illustrate the setup and instrumentation you need to make use of the four metrics types discussed above.
Basic Java metrics
The example is a working Java class with a main method where all of the action happens, both metrics instrumentation and the mocked application or service code. To keep the confusion out of this Java example, there are two parts to the code and it’s all found in the main method of this Java class.
The first part is setting up the instrumentation of a counter, a gauge, a histogram, and a summary. Along with the actual metrics instrumentation, a web server is started to serve the metrics end points for Prometheus to scrape or collect. This first part finishes with a statement in the system log that your web server has started, the path it’s listening on, and that your Java metrics setup is ready.
public static void main(String[] args) throws InterruptedException, IOException {

        // Set up and default Java metrics.

        //JvmMetrics.builder().register(); // uncomment to see all JVM metrics.

        // Initialize Counter.

        Counter counter = counter();

        // Initialize Gauge.

        Gauge gauge = gauge();

        // Initialize Histogram.

        Histogram histogram = histogram();

        long start = System.nanoTime();

        // Initialize Summary.

        Summary summary = summary();

        // Start thread and apply values to metrics.

        Thread bgThread = new Thread(() -> {

            while (true) {

                try {

                    counter.labelValues("ok").inc();

                    counter.labelValues("ok").inc();

                    counter.labelValues("error").inc();

                    gauge.labelValues("value").set(rand(-5, 10));

                    histogram.labelValues("GET", "/", "200").observe(Unit.nanosToSeconds(System.nanoTime() - start));

                    summary.labelValues("ok").observe(rand(0, 5));

                    TimeUnit.SECONDS.sleep(1);

                } catch (InterruptedException e) {

                    e.printStackTrace();

                }

            }

        });

        bgThread.start();

        // Set up web server.

        HTTPServer server = HTTPServer.builder()

                .port(METRICS_PORT)

                .buildAndStart();

        System.out.println("HTTPServer listening on port https://localhost:" + server.getPort() + "/metrics");

        System.out.println("");

        System.out.println("Basic Java metrics setup successful...");

        System.out.println("");
The second part is the actual Java code that you would write to implement your application or service. To not distract you from learning about instrumenting metrics, the code is simulated by a statement to the system log that your Java application or service has started.
// Insert your code here for application or microservice.

System.out.println("My application or service started...");

System.out.println("");
Below you see the output once this Java project has been compiled (mvn clean install) and started (java -jar target/java_metrics-1.0-SNAPSHOT-jar-with-dependencies.jar):
HTTPServer listening on port https://localhost:7777/metrics

Basic Java metrics setup successful…

My application or service started…
The web server reports that the Java metrics are being exposed for any Prometheus instance to scrape (collect) on port 7777, then follows that both the four basic metrics have been successfully initialized and the application code started.
Congratulations, you’re now running a fully instrumented Java application or service!
The build file
For those looking to run this example in a container, you are provided with a build file to be used with either Podman or Docker container tooling. Just run the following to build and start the container image.
# Build project jar file.

$ mvn clean install

# Build the container image using podman or docker.

$ podman build -t basic-java-metrics -f Buildfile

$ docker build -t basic-java-metrics -f Buildfile

# Run image mapping from 7777 local machine port to the

# exposed 7777 port on running container.

podman run -p 7777:7777 basic-java-metrics

docker run -p 7777:7777 basic java metrics
You’re now able to find your fully instrumented Java application or service in a container at https://localhost:7777.
Exploring your metrics
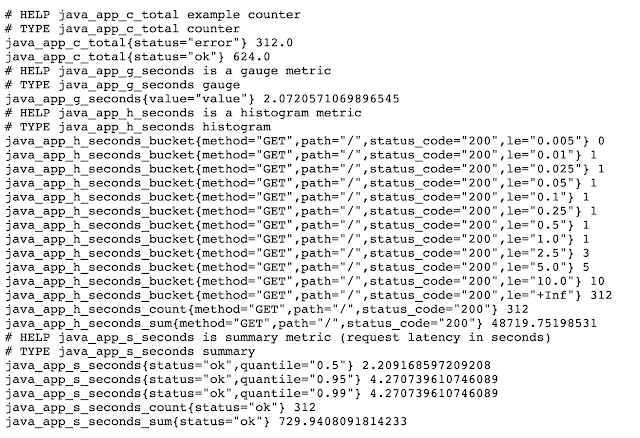
When you visit your exposed metrics url on https://localhost:7777/metrics you should see something like this:
If you want to collect these metrics using a Prometheus instance, you just need to ensure that you add the following target to your Prometheus configuration file (often prometheus.yml):
scrape_configs:
# Scraping java metrics.
- job_name: "java_app"
static_configs:
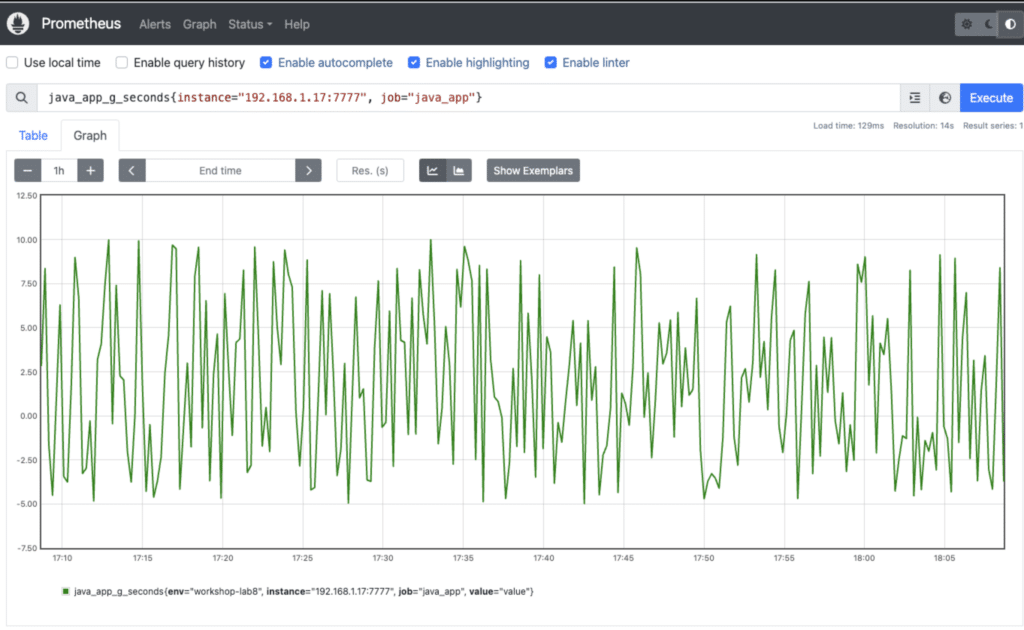
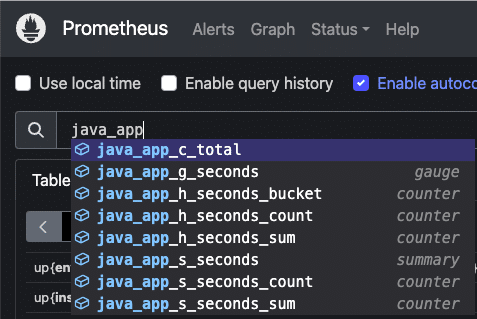
- targets: ["localhost:7777"]After restarting the Prometheus instance to pick up the new changes, you can see that they are being scraped and stored for visualization as needed. For example, here you can see them in the command completion feature of the Prometheus query console:
If you are looking to explore basic Java instrumentation of metrics with open source, creating each metric type from scratch in your own Java class, then you will have a great time in the lab on Instrumenting Applications from the free online getting started with Prometheus workshop. Check it out today and any feedback you might have is welcome!


