")

Prometheus and OpenTelemetry are two popular open source frameworks that help you obtain better insight into your systems and services. While Prometheus provides you with a full metrics-based monitoring pipeline, OpenTelemetry focuses on standardizing only the tracking of signals such as logs, traces, and metrics, inside an application, while not prescribing a storage and querying backend for these signals.
With the rising adoption of these two open source projects, many organizations will find themselves using both at the same time, and they may especially want to use Prometheus as a backend for their metrics generated by OpenTelemetry. This article looks at how these two systems overlap in their scope, why and how you may want to bridge metrics from one system into the other, and the pitfalls you should be aware of when considering this route.
Comparing the scope of OpenTelemetry and Prometheus
Before talking about integrating the two systems, let’s first understand their intended scope: Which observability goals do they aim to solve, where do they overlap in their responsibilities, and where do they diverge?
Visually, we can illustrate the scopes of Prometheus and OpenTelemetry like this:
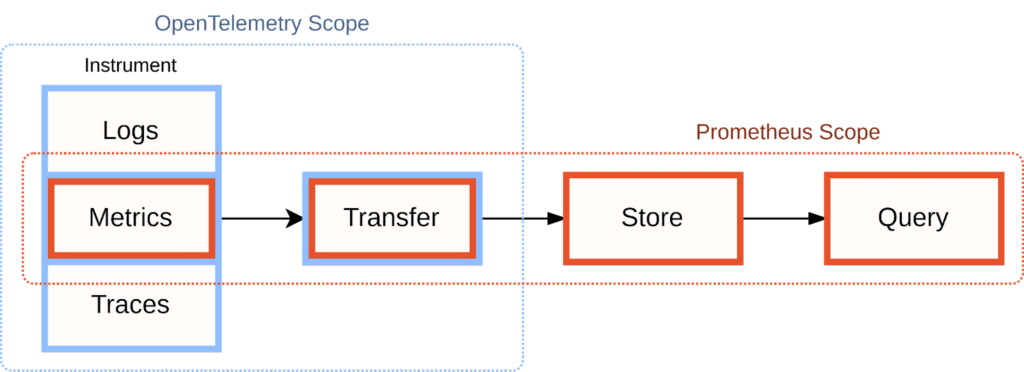
OpenTelemetry focuses solely on the data generation part of the observability pipeline:
– It standardizes instrumentation concepts around the three signal types of logs, metrics, and traces.
– It provides cross-language SDKs that allow you to track these signal types in your application in a consistent way.
– It defines a push-based wire format (the OpenTelemetry Protocol, OTLP) for exposing signals from your application.
– It provides the OpenTelemetry Collector, a component that allows you to collect and distribute your observability signals to further processing and storage systems.
Within the area of instrumentation, OpenTelemetry’s scope is broader than Prometheus, with OpenTelemetry supporting logs and traces in addition to Prometheus’ metrics-only approach. However, it deliberately does not weigh in on later stages of the monitoring pipeline, such as the storage or querying of these signals after they have been exposed from the instrumented service.
This is partly because OpenTelemetry was born out of a standards body that included many existing observability solution vendors. These vendors wanted to standardize the generation of incoming telemetry signals, while still being able to build and sell differentiated solutions for processing the resulting data.
On the flip side, Prometheus provides an opinionated set of tools for building an entire systems monitoring pipeline:
– It provides client libraries for instrumenting your services.
– It defines and implements a metrics transfer format that the Prometheus server uses to collect metrics from a service.
– It collects and stores your metrics.
– It allows you to query your metrics in flexible ways for use cases such as dashboarding, debugging, alerting, or capacity planning.
However, Prometheus focuses entirely on processing metrics only (numeric time series) and does not come with support for logs or traces. In practice, it is common for organizations to use other systems alongside Prometheus to handle the other two signal types.
This means that the two projects’ responsibilities overlap when it comes to instrumenting your application with metrics and sending these metrics to further processing stages in your observability pipeline:
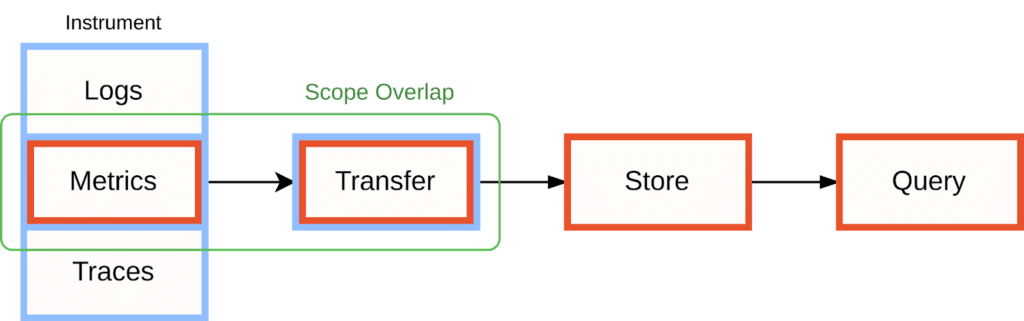
It is in this area of overlap where users will often want to bridge metrics between OpenTelemetry and Prometheus. Let’s have a look at why you may want to do this, and how.
Whitepaper: Getting Started with Fluent Bit and OSS Telemetry Pipelines
Getting Started with Fluent Bit and OSS Telemetry Pipelines: Learn how to navigate the complexities of telemetry pipelines with Fluent Bit.
Why you may want to use OpenTelemetry with Prometheus
In a pure Prometheus monitoring environment where you care mostly about tracking metrics, you may not need OpenTelemetry at all; you can rely on Prometheus’ own instrumentation libraries to track and expose metrics from your application and have the Prometheus server collect and store them:
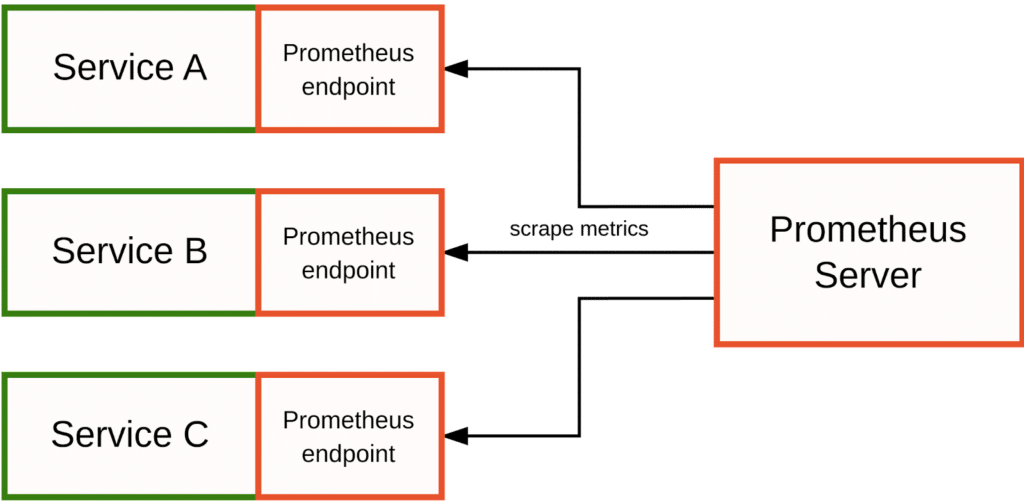
In fact, I would still recommend this approach to most users, since it yields the cleanest Prometheus metrics and allows you to make the best use of Prometheus’ active, pull-based monitoring model.
However, some organizations may care more about tracking all observability signals using a single integrated telemetry library. This is especially true if you want to derive aggregated metrics from logs or traces – for example, exposing an automatic metric that tells you how many times a specific error was logged. In this case, OpenTelemetry’s SDKs are a good way for bringing all three signal types together. OpenTelemetry does not come with a storage and querying system, but it allows you to bridge its signals into a backend of your choice. For metrics, Prometheus happens to be a popular backend choice.
You may also run into the opposite case, where you still have some services that expose native Prometheus metrics, but you want to collect these metrics into your OpenTelemetry Collector, so that you can merge them with your other signals and store them in a non-Prometheus backend. We will look at both cases in the next sections.
Bridging metrics between OpenTelemetry and Prometheus
In a fully native OpenTelemetry scenario, services use the OpenTelemetry SDK for instrumentation and then push the resulting telemetry to the OpenTelemetry Collector using OpenTelemetry protocol (OTLP):
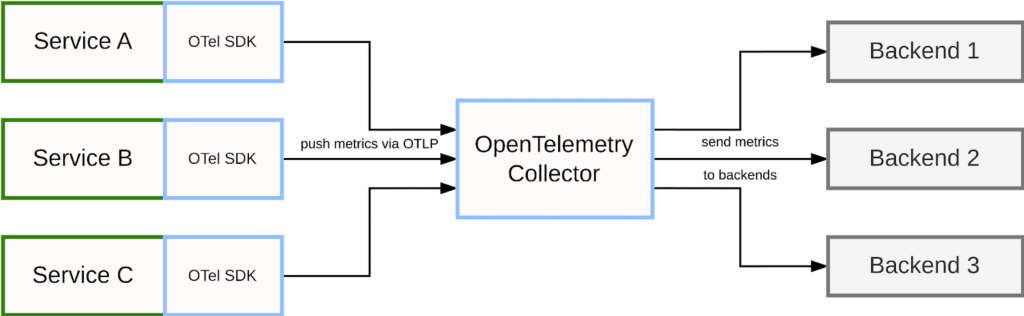
The collector receives signals from multiple services, optionally applies additional aggregations and transformations, and then acts as a bridge into other systems that can store and process the collected data further. For this purpose, the collector implements a number of exporter modules that allow you to send OpenTelemetry data to third-party backend systems. For example, the collector may send traces to a system like Jaeger, send logging data to Chronosphere, or send metrics to a Prometheus server.
Bridging Prometheus metrics into OpenTelemetry
One situation you may find yourself in is you want to use OpenTelemetry as the backbone of your telemetry collection pipeline, but some of your services only expose metrics in Prometheus’ native format and are collected over HTTP.
Normally, the OpenTelemetry Collector would receive metrics via OTLP, but in this case you can configure it to emulate the behavior of a Prometheus server and actively scrape your instrumented Prometheus endpoints:
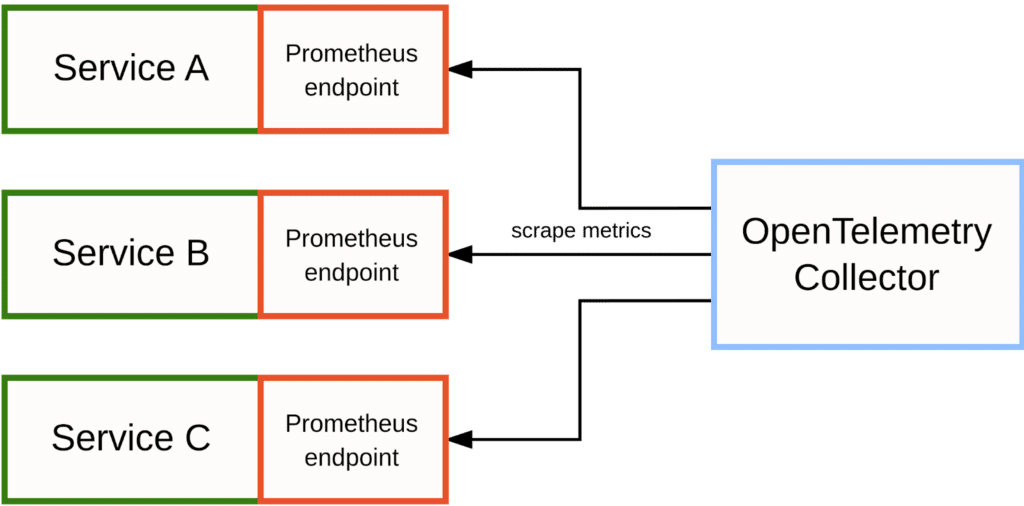
To achieve this, there are two alternative receiver modules that you can enable in the OpenTelemetry Collector:
The Prometheus Receiver allows you to reuse an entire scrape configuration section from your Prometheus configuration file, including support for all service discovery methods available in Prometheus itself. This is great for making the collector scrape Prometheus metrics from larger and more dynamic setups.
The Simple Prometheus Receiver is a simple wrapper around the full Prometheus Receiver that allows you to specify a single fixed endpoint to scrape metrics from. This receiver is only suitable for small, one-off use cases.
Either of these receiver modules allows you to bridge native Prometheus metrics into the OpenTelemetry Collector, merging them with the rest of your telemetry data there.
Bridging OpenTelemetry metrics into Prometheus
Conversely, if you want to store OpenTelemetry metrics in a Prometheus backend, the OpenTelemetry Collector provides multiple alternative exporter modules to enable this use case:
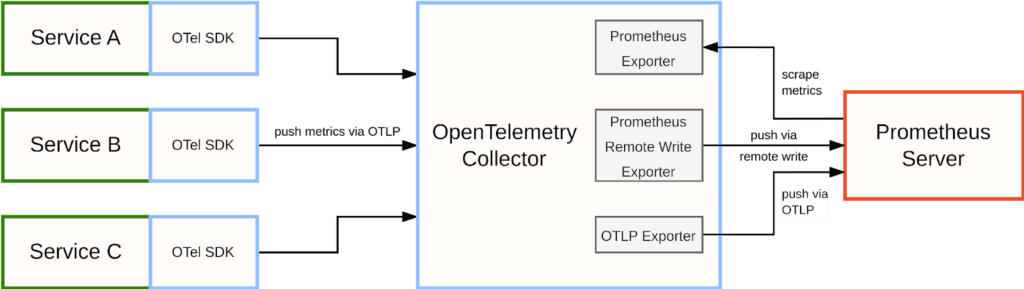
The Prometheus Exporter exposes all collected data as native Prometheus metrics on an HTTP endpoint in the OpenTelemetry Collector. You can then configure your Prometheus server to scrape this endpoint as you would for a regular service. However, this approach is not recommended for larger use cases, as it forces all of your metrics into a single large Prometheus scrape, introducing scaling and reliability issues.
The Prometheus Remote Write Exporter uses Prometheus’ “remote write” protocol to push metrics to a Prometheus server. The remote write protocol is a standard from the Prometheus ecosystem optimized for pushing large amounts of metrics data from one monitoring server to another, making it suitable for larger use cases.
Prometheus recently also added experimental support for directly receiving metrics via OTLP, which is a good alternative to using the remote write format. You can then use the collector’s OpenTelemetry Protocol Exporter to send metrics to Prometheus using OTLP.
Whichever of these options you choose, Prometheus can then store your OpenTelemetry metrics data so you can use it for dashboarding, alerting, and other use monitoring cases.
What to know before bridging metrics between the two systems
While bridging metrics between these two systems is possible, it comes with a number of downsides that you should at least consider. This is especially true when storing OpenTelemetry metrics in Prometheus. Let’s have a look at a few of the pitfalls you may encounter.
Incompatible metric naming conventions and character sets
While OpenTelemetry allows any UTF-8 character in metric and label names, Prometheus is more restrictive and only allows letters, numbers, underscores, and colons (the latter only in metric names). Prometheus conventions also expect metric names to include units and other relevant suffixes, such as a _total suffix for counter metrics. This means that an OpenTelemetry metric like k8s.pod.cpu.time is renamed to k8s_pod_cpu_time_seconds_total in Prometheus, and its labels may have to be translated as well. This can be confusing and makes it harder for users to correlate data between signal types and observability systems.
To improve on this situation, Prometheus is planning on adding full UTF-8 character set support for metric names and labels in the future. There is also an ongoing discussion about changing the way that metric name suffixes are bridged between the two systems.
Lack of active health monitoring
In a native Prometheus setup, the Prometheus server is responsible for discovering the service endpoints to monitor and to actively pulling metrics from them on a periodic basis. Using a synthetic up metric with a sample value of 1 or 0, the server records the success or failure of every scrape of a metrics endpoint, which allows you to establish basic health tracking and alerting for a service. When bridging push-based metrics from OpenTelemetry, you lose this free benefit, and it will be especially difficult to learn about any processes that have never managed to report in at all.
To address this lack of a scrape health indicator metric and associated health monitoring, Prometheus developers are planning on building a bridging layer that correlates incoming OpenTelemetry metrics data with data from Prometheus’ own service discovery functionality. This would allow the Prometheus server to detect when data from an expected service endpoint has not arrived, and Prometheus could then record an appropriate up metric value that marks the endpoint as unhealthy.
Prometheus’ target labels vs. OpenTelemetry’ resource attributes
In a native Prometheus context, the Prometheus server will associate a set of identifying labels with each service endpoint that it is pulling metrics from: these are called target labels, and they are attached to all metrics that are pulled from the corresponding endpoint. Target labels help you identify where a metric came from, and they will usually include attributes such as the service name (also called “job” in Prometheus) and the hostname and port that the metrics were pulled from. Target labeling schemes are not standardized in Prometheus, and administrators have a lot of control over the type of metadata they may want to include in them. In practice though, most configurations produce relatively small and concise target label sets, since the resulting metrics would become too polluted with unneeded metadata and hard to work with otherwise.
In the OpenTelemetry world, there is a similar concept of attaching service metadata labels to signals: These are called “resource attributes” in OpenTelemetry, with a “resource” referring to the service or device being monitored. Resource attributes are more standardized than Prometheus’ target labels, and they are also very detailed and numerous. As a result, resource attributes are currently not mapped into every bridged Prometheus metric and only separately tracked via a single target_info metric per monitored resource. Prometheus users then have to join in this metric in queries in a cumbersome way if they want to either filter their metrics on a resource attribute or return resource metadata as part of a query result.
For example, if you wanted to query the HTTP request rates of a service running on a Kubernetes cluster and you wanted to include the Kubernetes namespace as a label on the series in the query result, it would not be sufficient to query for the request rates themselves like this:
rate(http_server_request_duration_seconds_count[5m])
Since the Kubernetes namespace label is only present on the separate target_info metric as a k8s.cluster.name label, you would have to join it with the request rates like this:
    rate(http_server_request_duration_seconds_count[5m])
* on(job, instance) group_left(k8s_cluster_name)
    target_info
While there is no great solution for this mismatch, Prometheus developers are planning on adding a feature to Prometheus that would allow you to configure a subset of OpenTelemetry resource attributes to directly map into all of your metrics, just like Prometheus target labels would be.
Counter metric types
OpenTelemetry supports two different counter metric types: counters that expose cumulative totals over time, as well as counters that only transmit the accrued delta (difference) relative to the previous push of the same metric. In contrast, Prometheus only supports cumulative counter metrics, as sending deltas would not fit well into Prometheus’ pull-based monitoring model with idempotent scrapes allowing multiple Prometheus servers to pull metrics from the same target at once.
To support storing delta counters originating from OpenTelemetry, the Prometheus team is planning solutions such as converting deltas into cumulative counter values as they enter the Prometheus server.
Out-of-order data
OpenTelemetry does not guarantee that telemetry data arrives in time-based order, so a minute-old data point may arrive after one that is 5 seconds old. By default, Prometheus does not support storing samples that are not temporally sorted within a given time series, but you can enable experimental support for out-of-order writes to allow for the occasional misordering in incoming OpenTelemetry data.
Conclusion
In this article we explored the differences in scope and intent between the Prometheus and OpenTelemetry projects, and why you may want to use both of them together in your organization. Whether you have existing Prometheus-instrumented services that you want to bridge into your OpenTelemetry infrastructure, or whether you want to store your OpenTelemetry metrics in a Prometheus server, the two projects offer plenty of adapters to translate metrics from one system to the other.
However, the two frameworks also have different conventions and semantics in the way they model and transfer metrics, so bridging metrics from one system to the other comes with downsides. Whether it’s surprising metric and label name changes, obtuse handling of resource metadata labels, or other issues, it is at least good to be aware of these issues before choosing to use Prometheus and OpenTelemetry together.
Finally, if you decide to use a platform to manage your telemetry and help with metrics sprawl, use Chronosphere. Purposely built for open source compatibility, the platform can ingest Prometheus and OpenTelemetry data, help you figure out what data is most useful, and inform any decisions to drop or rollup.
For more information on Prometheus, check out the following articles from Julius:
– A guide to the top telemetry and tools for system reliability
– 5 reasons Prometheus is a natural fit for cloud native monitoring
– How to address Prometheus scaling challenges
– How to use Prometheus to monitor your services on Kubernetes
– Top 3 queries to add to your PromQL cheat sheet
– The importance of compatibility when choosing a Prometheus vendor
Whitepaper: Breaking Vendor Lock-in with Prometheus
Get the tools you need to adopt open source and break free of your observability vendor


