Organizations face significant challenges in collecting, processing, and managing observability data in the modern infrastructure and application landscape. There is always more data to ingest and more tools to route to. The result is more noise, decreased developer efficiency, and increased costs.
Chronosphere Telemetry Pipeline from the creators of Fluent Bit and Calyptia enables you to seamlessly manage your data from any source to any destination. Telemetry Pipeline integrates with your existing sources in minutes and enables turnkey enrichment, processing, transformation, and routing of data to multiple destinations.
Telemetry Pipeline includes dozens of out-of-the-box processing rules for transforming and enriching data in flight. These rules include converting data from one format to another, removing fields, redacting sensitive data, and more.
There may be times, however, when no out-of-the-box solution will accomplish the exact processing you need. For example, you may need to apply some complex business logic to the data or enrich the data with some sort of computation. For such bespoke needs, Telemetry Pipeline also lets you write custom processing rules using Lua.
Lua is a lightweight, high-level, multi-paradigm scripting language designed primarily for embedded use in applications. It has a Python-like syntax, making it easy for many developers to pick up. It is widely used as an extension library, including in apps such as World of Warcraft, Adobe Photoshop Lightroom, and Redis. Lua’s built-in pattern matching makes it well suited for parsing and transformation of records, and Lua scripts are typically much less resource-intensive than complex regex formulas.
But what if you don’t know Lua or you need some help debugging your code? Telemetry Pipeline integrates Generative Pre-trained Transformers (GPT) to bring the power of artificial intelligence (AI) to help you write your bespoke Lua code. AI is also embedded into many of Telemetry Pipeline’s other out-of-the-box processing rules to provide assistance with generating regex and more.
In this blog post, we’ll demonstrate how to use Lua and GPT to simplify the processing of observability data as it flows through your pipelines.
Getting started
For the purposes of this blog, we’ll skip setting up the initial telemetry pipeline, but if you are new to Telemetry Pipeline, you may want to watch this walk-through of installing Telemetry Pipeline and configuring a pipeline or check out the docs.
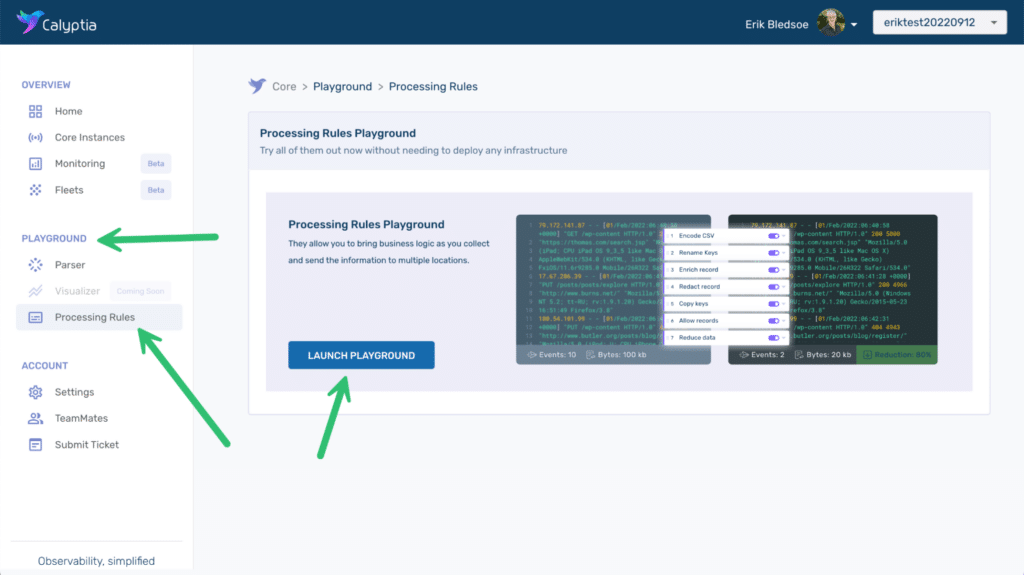
If you would like to follow along with the examples you can sign up for a free trial of Telemetry Pipeline. We’ll be using the processing rules playground. The playground lets you experiment with processing rule modifications nondestructively. You can even import samples of your actual data so that you can see exactly the impact of any modifications before applying them to your actual pipeline.
We’ll be using an Apache2 access log as sample input. You can download the data here if you would like to use it to follow along with the examples.
Parse your log data into structured JSON using AI
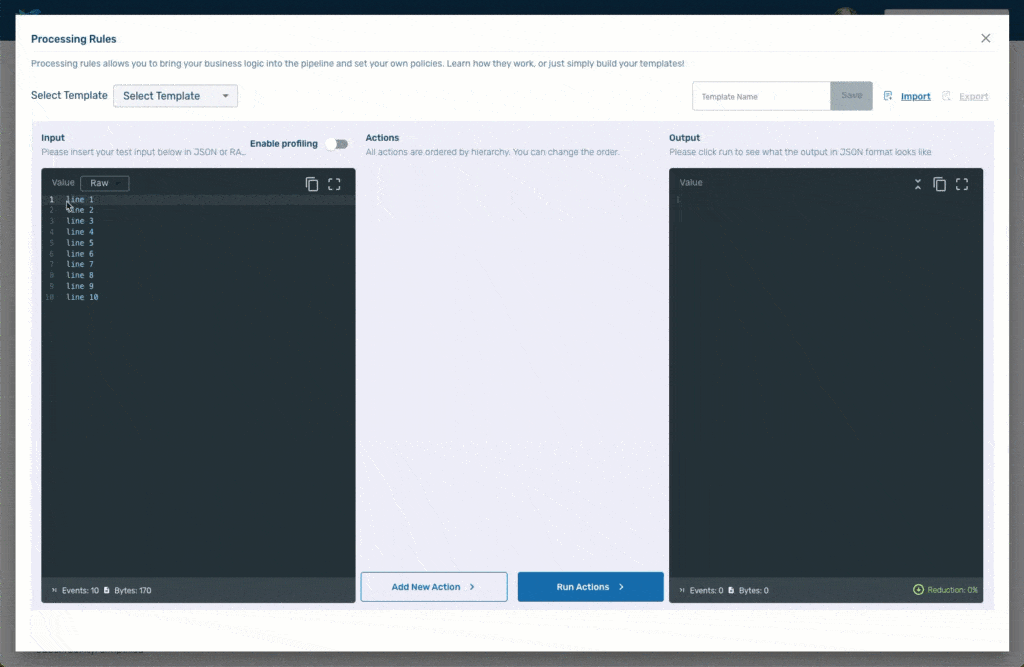
When you first launch the playground it preloads some default sample data in the input screen. Simply select and delete the default data and paste in our sample log file. Then hit the Run Actions button. With no other processing rules enabled, Telemetry Pipeline transforms the raw log data into JSON.
However, in this case, it has created each log entry as a single key value pairing.
{
"log": "79.172.141.87 - - [01/Feb/2022:06:40:58 +0000] \"GET /wp-content HTTP/1.0\" 200 5000 \"https://thomas.com/search.jsp\" \"Mozilla/5.0 (iPad; CPU iPad OS 9_3_5 like Mac OS X) AppleWebKit/534.0 (KHTML, like Gecko) FxiOS/11.6r9285.0 Mobile/26R322 Safari/534.0\""
}
{
"log": "17.67.206.39 - - [01/Feb/2022:06:41:28 +0000] \"PUT /posts/posts/explore HTTP/1.0\" 200 4966 \"http://www.burns.net/\" \"Mozilla/5.0 (Windows NT 5.2; tt-RU; rv:1.9.1.20) Gecko/2015-05-23 16:51:49 Firefox/3.8\""
}
We prefer a more structured output, so our first transformation will be to parse the logs into distinct key-value pairs.
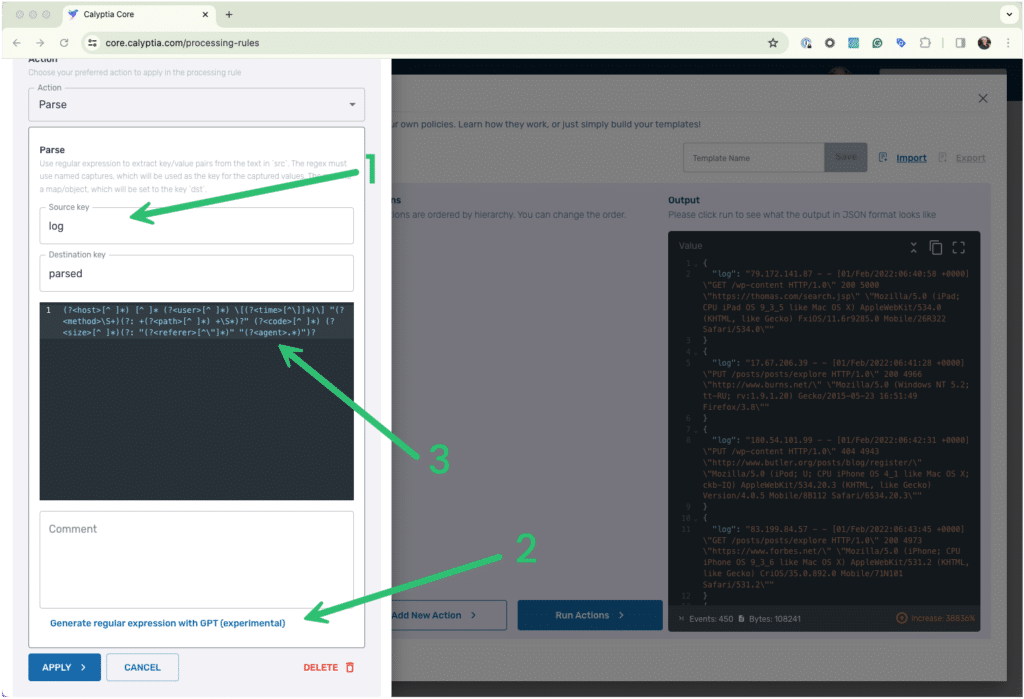
Press the Add New Action and then select Parse from the dropdown list of available actions. Type in “log” as the source key. You can leave the Destination Key field as the default “parsed” value.
The Parse rule uses regular expressions (regex) to transform your input. But if you are like me, generating the proper regex is difficult. But fortunately it is something that GPT excels at. Click the link “Generate regular expression with GPT” to let it go to work.
The GPT-generated regex will appear in the window in less time than it would take to type it and much less time than I would normally spend Googling and experimenting to see if someone had already solved the problem for me.
Tip: If you receive an error message when GPT tries to generate the regex, try removing all but a single log entry from the input screen and try again. You can add the full dataset back after GPT successfully generates the regex.
Apply the new Parse rule and then run actions again to see the result, which should look something like this.
{
  "parsed": {
    "time": "01/Feb/2022:06:40:58 +0000",
    "user": "-",
    "path": "/wp-content",
    "code": "200",
    "agent": "Mozilla/5.0 (iPad; CPU iPad OS 9_3_5 like Mac OS X) AppleWebKit/534.0 (KHTML, like Gecko) FxiOS/11.6r9285.0 Mobile/26R322 Safari/534.0",
    "method": "GET",
    "referer": "https://thomas.com/search.jsp",
    "size": "5000",
    "host": "79.172.141.87"
  },
  "log": "79.172.141.87 - - [01/Feb/2022:06:40:58 +0000] \"GET /wp-content HTTP/1.0\" 200 5000 \"https://thomas.com/search.jsp\" \"Mozilla/5.0 (iPad; CPU iPad OS 9_3_5 like Mac OS X) AppleWebKit/534.0 (KHTML, like Gecko) FxiOS/11.6r9285.0 Mobile/26R322 Safari/534.0\""
}
Clean up your JSON output with out-of-the-box processing rules
Our output is closer to what we expect to see, but we probably don’t want to keep the entire untransformed log entry as a single key-value pair. Nor do we want our log data to be a child of the parsed key.
Telemetry Pipeline lets you apply multiple rules to your data. They will run in the order presented in the Actions section of our screen.
Let’s add two more out-of-the-box actions.
First add a Delete Key rule and indicate that you want to delete the “log” key.
Then add a Flatten Subrecord rule and indicate that the key you would like to flatten is “parsed” — you can leave the other settings as the defaults.
Once you apply the rules and run the actions, your output should look like this:
{
  "time": "01/Feb/2022:06:40:58 +0000",
  "user": "-",
  "path": "/wp-content",
  "code": "200",
  "referer": "https://thomas.com/search.jsp",
  "agent": "Mozilla/5.0 (iPad; CPU iPad OS 9_3_5 like Mac OS X) AppleWebKit/534.0 (KHTML, like Gecko) FxiOS/11.6r9285.0 Mobile/26R322 Safari/534.0",
  "method": "GET",
  "host": "79.172.141.87",
  "size": "5000"
}
That looks perfect, just the way we want it, so far.
Create a custom log transformation with Lua
In the examples above, we’ve seen how Telemetry Pipeline can save hours of an engineer’s time by using Telemetry Pipeline out-of-the-box processing rules to transform log data rather than writing custom transformations. But there may be times when you need a more bespoke solution. That’s what the Custom Lua action provides.
We’ll start with a very simple example. Adding a new key-value pair to our output.
Add a new action, and select Custom Lua. Replace the default text with the following.
return function(tag, ts, record, code)
  record.greeting = "Hello world"
  return code, ts, record
end
In the Custom Lua processing rule, you can access a particular field (“field_a” for example) by using record.field_a or record[‘field_a’]. This works both for existing fields and new fields you would like to create. So our Lua code creates a new field named greeting and adds a value of Hello world to it.
Once you apply the rule and run the actions, your output should look something like this.
{
  "time": "01/Feb/2022:06:40:58 +0000",
  "user": "-",
  "path": "/wp-content",
  "referer": "https://thomas.com/search.jsp",
  "code": "200",
  "method": "GET",
  "size": "5000",
  "greeting": "Hello world",
  "host": "79.172.141.87",
  "agent": "Mozilla/5.0 (iPad; CPU iPad OS 9_3_5 like Mac OS X) AppleWebKit/534.0 (KHTML, like Gecko) FxiOS/11.6r9285.0 Mobile/26R322 Safari/534.0"
}
Truthfully, we could have accomplished the same effect more easily by applying the out-of-the-box Add/Set key/value rule, but this is a Lua tutorial. Now let’s do something more interesting than saying hello to the world.
Use AI to generate your Lua log transformation
Let’s imagine a situation where you want to alert when there are errors accessing your application and elevate the situation immediately when a particular client is having issues. Telemetry Pipeline can process the data in-flight and apply your business logic so that when your alerting platform receives the data, the actionable items are already clearly identified.
Let’s add another Custom Lua rule. But this time, we’ll take advantage of Telemetry Pipeline’s GPT integration to generate a Lua script that is more complex than our simple “hello world” effort.
In the comment field of the Custom Lua rule enter the following prompt and click “Generate processing rule from comment with GPT”:
If the value of code is anything other than "200" set priority equal to "P3". However, if the code is anything other than "200" and the referer contains "burke.com" set priority to "P1". Otherwise, if code equals "200" set priority to ""
Calyptia’s GPT integration should generate a Lua script resembling this (complete with commenting!):
return function(tag, ts, record)
    -- check if code is not equal to "200"
    if record['code'] ~= '200' then
        -- check if referer contains "burke.com"
        if string.match(record['referer'], 'burke.com') ~= nil then
            -- set priority to "P1"
            record['priority'] = 'P1'
        else
            -- set priority to "P3"
            record['priority'] = 'P3'
        end
    else
        -- set priority to ""
        record['priority'] = ''
    end
    return 1, ts, record
end
After we apply and run the action, we can search our output to find our transformations.
Tip: You can search both the input and the output in the processing rules by clicking into the area and then pressing Ctrl-F / Command-F. You can also use regex in your search.
A log with a code value of 200 should look like this, with the value of priority being empty.
{
  "size": "5000",
  "host": "79.172.141.87",
  "priority": "",
  "user": "-",
  "path": "/wp-content",
  "code": "200",
  "time": "01/Feb/2022:06:40:58 +0000",
  "referer": "https://thomas.com/search.jsp",
  "greeting": "Hello world",
  "agent": "Mozilla/5.0 (iPad; CPU iPad OS 9_3_5 like Mac OS X) AppleWebKit/534.0 (KHTML, like Gecko) FxiOS/11.6r9285.0 Mobile/26R322 Safari/534.0",
  "method": "GET"
}
When we find a log with a 404 error it should look like this, with the value of priority being P3.
{
  "size": "4943",
  "host": "180.54.101.99",
  "priority": "P3",
  "user": "-",
  "path": "/wp-content",
  "code": "404",
  "time": "01/Feb/2022:06:42:31 +0000",
  "referer": "http://www.butler.org/posts/blog/register/",
  "greeting": "Hello world",
  "agent": "Mozilla/5.0 (iPod; U; CPU iPhone OS 4_1 like Mac OS X; ckb-IQ) AppleWebKit/534.20.3 (KHTML, like Gecko) Version/4.0.5 Mobile/8B112 Safari/6534.20.3",
  "method": "PUT"
}
But the same error when it comes from burke.com warrants a P1 prioritization.
{
  "size": "4917",
  "host": "154.24.70.230",
  "priority": "P1",
  "user": "-",
  "path": "/posts/posts/explore",
  "code": "404",
  "time": "01/Feb/2022:17:01:24 +0000",
  "referer": "http://www.burke.com/privacy/",
  "greeting": "Hello world",
  "agent": "Mozilla/5.0 (X11; Linux i686; rv:1.9.5.20) Gecko/2015-01-04 18:00:51 Firefox/14.0",
  "method": "GET"
}
Try it yourself
In just a few minutes we have used Telemetry Pipeline to transform raw Apache2 logs into structured JSON and applied additional bespoke transformations that reflect specific business requirements. Although we didn’t cover building a pipeline in this blog, it would only take a few more minutes to configure Telemetry Pipeline to send our transformed data to any number of destinations.
To try it yourself, sign up for a free trial and use the processing rules playground as we did today. You can even use your own sample data to see exactly how you can transform your telemetry data in flight before it is delivered to your backends.


