")


Troubleshoot anomalies like an expert
Chronosphere is excited to announce Differential Diagnosis (DDx) for Metrics—a new capability that helps everyone troubleshoot anomalies like an expert. DDx automatically analyzes all available dimensions to highlight what changed and what didn’t, helping you understand anomalies and get to the root cause faster.
It removes the bottleneck of relying on tribal knowledge that slows down investigations, delivering faster, more consistent troubleshooting without the need for sprawling dashboards, overly dense charts, or complex alerting strategies.
Metrics are powerful—but also a problem
Metrics are the backbone of observability. They tell you what’s happening, when it started, and how bad it is. But in modern, Kubernetes-based environments, the sheer volume and complexity of metric data has become a double-edged sword.
You’re collecting millions of metrics. Each one has multiple dimensions, creating even more time series, and labels that are constantly evolving as your services change. You try to stay ahead of it all with dashboards, alerts, and more dashboards. But before long, you’re buried in noise.
- Dashboards sprawl out of control
- Alerts become brittle or fire too often, or not at all
- Developers waste time digging around trying to find the right dimensions
- And when an incident hits, you don’t know where to start
Even experienced engineers struggle. There’s just too much data, and not enough context. Meanwhile, less experienced developers are stuck waiting for someone with the right “tribal knowledge” to make sense of it all.
The result? Slow incident response. Frustrated teams. Inconsistent troubleshooting. And costly downtime.
Meet DDx for Metrics: Troubleshooting that works like an expert
Chronosphere’s new Differential Diagnosis (DDx) for Metrics changes the game for metric-based troubleshooting.
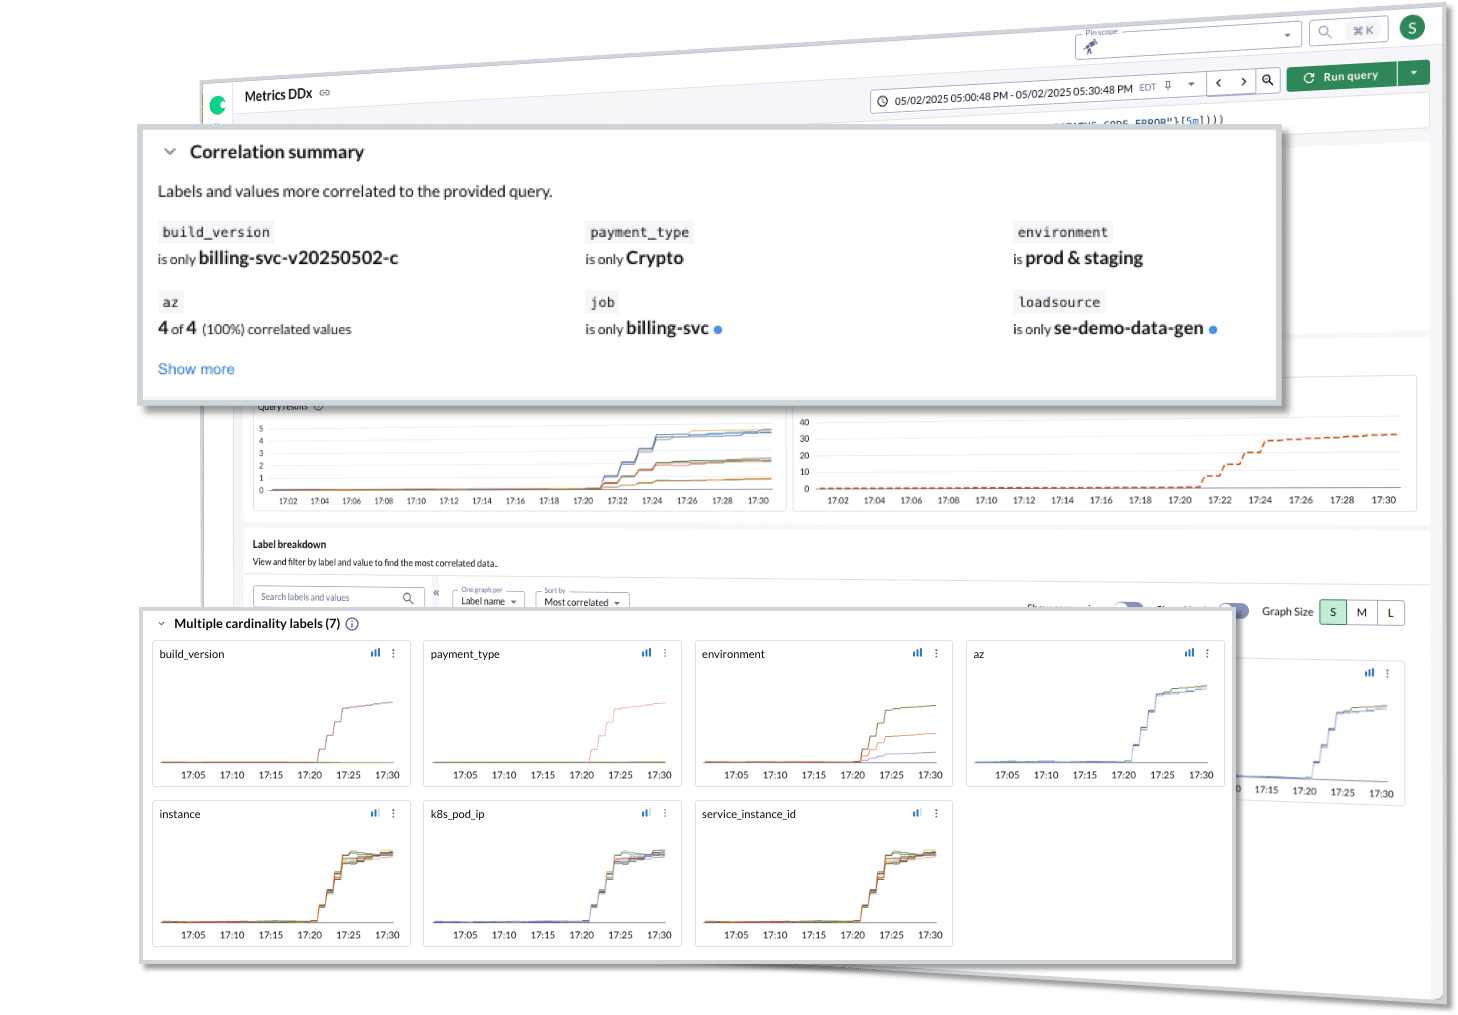
Instead of guessing which dimension might explain an anomaly, DDx for Metrics does the hard part for you. It automatically analyzes every available dimension in your metric data and tells you what changed—and just as importantly, what didn’t.
If you spot something unusual in a chart (a spike, a dip, a strange shape) you can launch DDx right from where you are in Chronosphere.
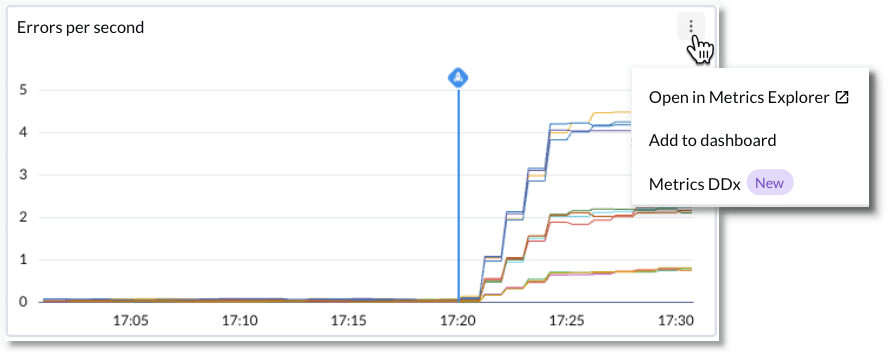
Behind the scenes, Chronosphere’s correlation engine kicks in, identifying which labels are related to the anomaly. No switching tools. No writing PromQL. No relying on someone who “knows the system and the data.”
It’s like having your most experienced engineer, the one who knows how to methodically and comprehensively analyze time series data, built right into your workflow.
See DDx for Metrics in Action
Watch this 2-minute demo to see how DDx empowers every member of your team to troubleshoot like an expert.
Why DDx matters now
Modern engineering teams face a perfect storm: fast-moving architectures, ever-changing data, and growing pressure to resolve issues faster.
Kubernetes environments, in particular, are dynamic by design. Labels change. Services scale up and down. New teams ship new code with new telemetry, often without coordination. The result is a system in constant motion, where yesterday’s dashboards might not explain today’s issue.
At the same time, engineering teams are increasingly distributed. Developers may own only a slice of the system, and few have deep familiarity with how everything connects. The people who do have that knowledge are often spread thin, or burned out from being the on-call heroes managing to keep things running.
Legacy observability practices haven’t kept up:
- Overly specific alerts break when labels change
- Dashboards grow stale or overly complex
- Troubleshooting depends on who’s available, not what’s visible
DDx for Metrics is built for this reality. It adapts to new data, removes reliance on tribal knowledge, and gives any developer the power to troubleshoot like a pro. It’s a modern approach to a modern problem—and one that scales with your system and your team.
Three problems solved by DDx
1. Slow and inconsistent anomaly cause analysis
When an anomaly is detected, teams often waste valuable time clicking through dashboards and manually guessing which dimensions might explain what they’re seeing.
DDx for Metrics instantly correlates all available dimensions, surfacing what’s relevant, enabling rapid hypothesis testing, even without prior system, data, or querying knowledge.
2. Metrics overload and maintenance complexity
Over-visualizing and over-alerting on every possible failure mode leads to bloated dashboards and brittle alerts.
DDx encourages a shift to robust, high-signal metrics, allowing developers to monitor symptoms, then drill down when anomalies occur.
3. Lack of adaptability to changing systems and data
Static dashboards break when systems evolve.
DDx for Metrics automatically adapts to new labels and dimensions, keeping investigations accurate and up-to-date without rework.
What makes DDx for metrics different
- Focus on symptoms, not causes: Monitor what matters. Visualize and alert on resilient, high-level symptoms rather than micromanaging every individual metric, and let DDx guide the deep dive when things go wrong.
- In-context, automated correlation: Launch DDx directly from a chart or even a specific series on a chart. No query writing, no pre-configuration. It surfaces what’s changing (and what’s not) in real time.
- Adaptive to changing data: New labels? Evolving services? DDx automatically accounts for changes in your data, so you’re always troubleshooting with the current context.
- See beneath the surface with X-Ray: Simplified metrics are great for performance, but they hide detail when you need it. X-Ray reveals the raw, high-cardinality dimensions underneath metrics produced by recording rules and derived metrics so you can troubleshoot without switching tools or manually re-writing queries.
- Fast, repeatable, and comprehensive: Designed for high-scale environments and fast-moving teams. DDx is intuitive enough for anyone to use and powerful enough to trust during a major incident.
Results teams can expect
- Faster resolution times: No more guesswork or Slack roundups to find the expert
- Fewer dashboards to maintain: Focus on high-signal metrics, not dashboard sprawl
- Empowered developers: Junior engineers level up; senior engineers move faster
- Operational consistency: Less firefighting, more confidence
- Observability that adapts to change: No rework, no stale dashboards
FAQ: DDx for Metrics
Do I need to know PromQL to use DDx?
No. It’s entirely queryless. You launch it directly from a chart with no query writing or setup required.
Can I use DDx for Metrics with custom or derived metrics?
Yes. DDx works with both raw and derived metrics. With X-Ray, you can also see hidden dimensions behind simplified metrics like recording rules.
How is DDx different from traditional metric drilldowns or dashboards?
DDx automatically correlates and scores all dimensions in real time. No filters, no setup, no switching tools.
What role does X-Ray play in all of this?
X-Ray provides instant access to hidden labels and dimensions behind simplified metric queries – allowing you to add deeper context when troubleshooting incidents.
Is DDx only for metrics?
No. DDx is also available for traces (and soon logs). Check out this blog post about DDx for Traces.
Get Started with DDx for Metrics
Ready to troubleshoot faster? See DDx for Metrics in action