


Let’s go on vacation
Before the vacation kicks off, you decide to keep a record of your travels and activities, starting from the first full day of vacation.
You start day one at your hotel. From there you head off to the market to look for souvenirs and get some brunch, before making a trip to the zoo. Following that, you grab a hotdog by the bay for dinner before turning in for the night.
Day two involves a tour that visits a bunch of different locations: waterfalls, a vineyard, and a bakery. Unlike day two, all your travel is handled by the tour company’s bus.
Finally on day three you visit the museum, spend some time in the portrait gallery, but you enjoy the landscapes the most. You get lunch at the museum cafe and take a stroll in the park in the afternoon. You end your vacation with a fancy dinner out at a restaurant before walking back to the hotel.
Ok, what does this have to do with distributed tracing?
Sketching out each day like a distributed trace and displaying it across time might look something like this:
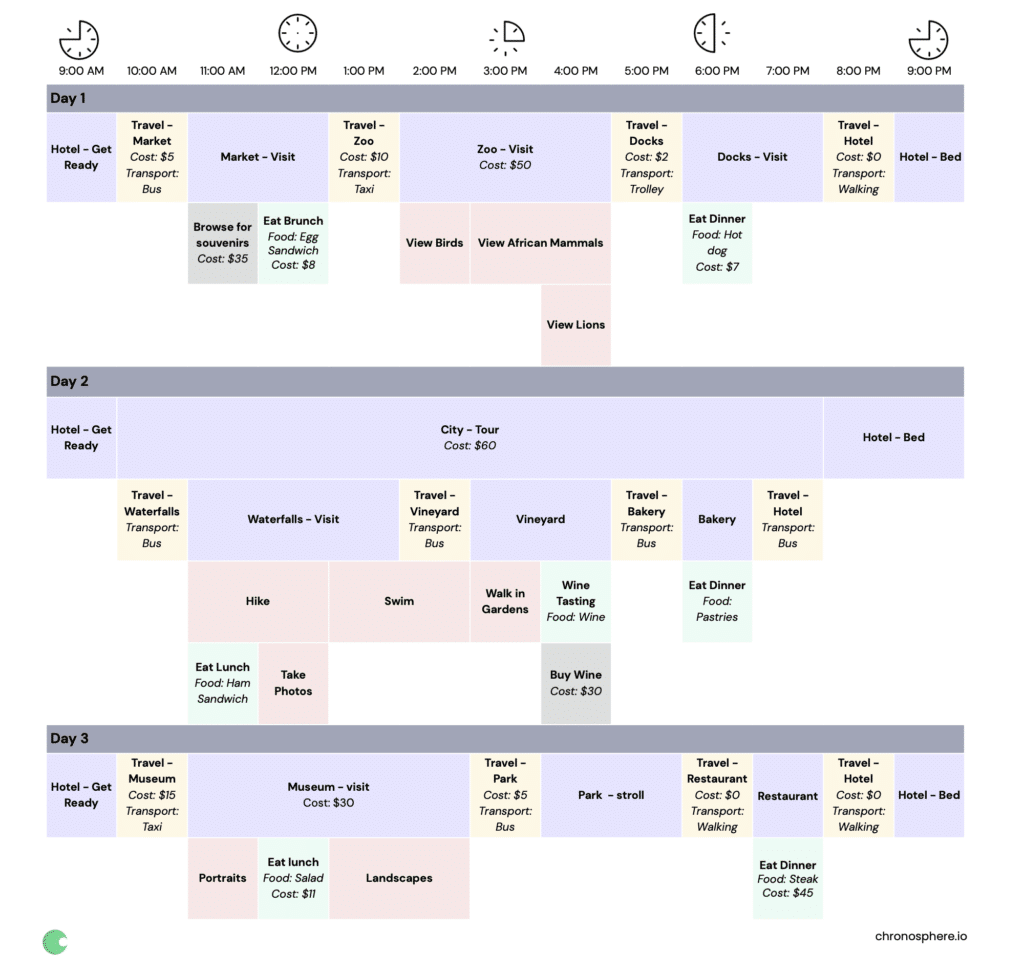
This approach makes it easy to represent the activities during this holiday in a way that makes it easy to see key details like:
- How much time is spent on each activity
- Which location each activity is related to
- Costs associated with an activity
- The food eaten at each meal
Now let’s map some of these key details to what you would see in a trace of a distributed system, like a microservices environment:
- Each travel activity is a trace span (work done by an individual service or component)
- Each activity’s location is a span service
- Each activity’s description is a span operation
- Details like cost and food are a span’s tags
Certain activities can be further broken down into related activities, such as the overall day two tour having several trips on the bus, as well as fun things to do at each location. Tying it all together, your travels each day are similar to the path that a request takes through multiple services in a services oriented architecture (SOA) or microservices enviro
Questions only distributed traces can answer
Aside from recording details, these distributed traces of the vacation can be used to answer useful questions.
For example, imagine we wanted to add up the cost of food for each day — we can look specifically for activities (spans) with a food and a cost, and then add those up.
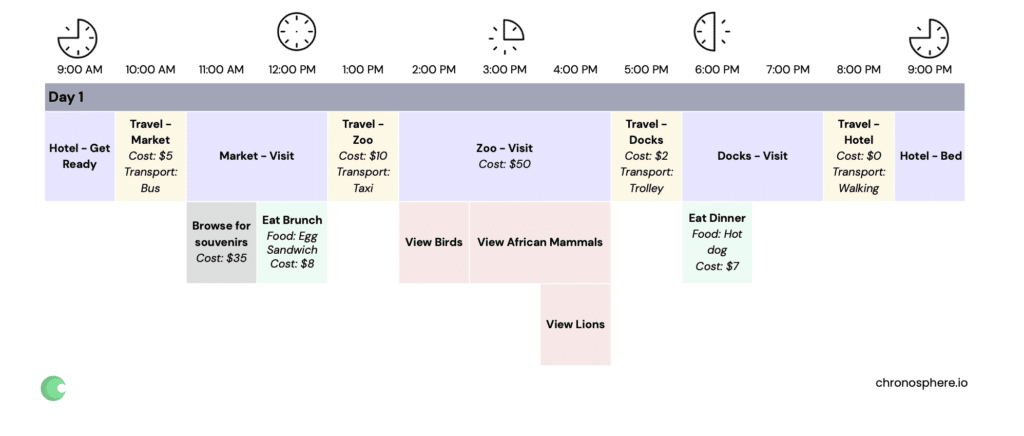
On day one, this would be an egg sandwich and hotdog, for a total of $15.
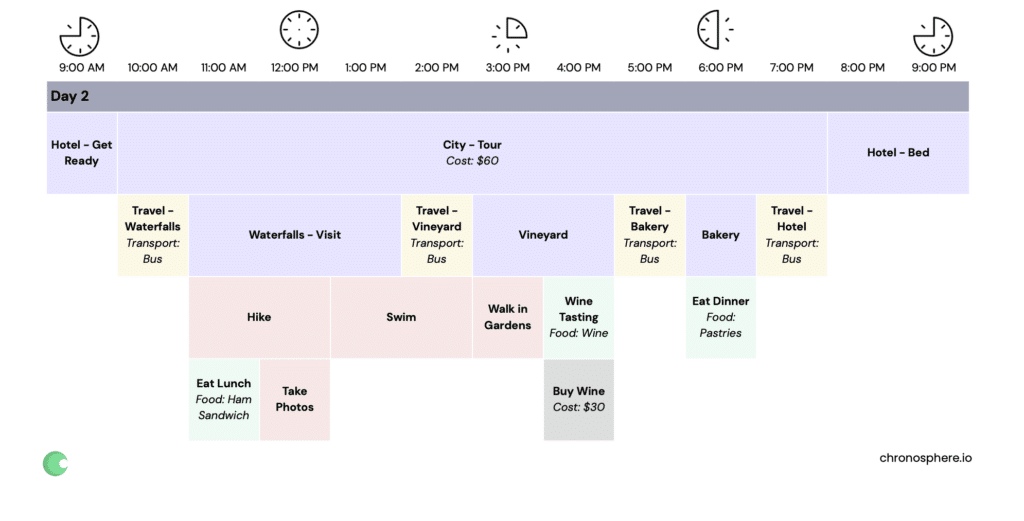
On day two, there are no activities that have both a cost and food.
If you wanted to find out which day cost the least in terms of food eaten for meals, you can compare these two days and determine that day two cost more.
Maybe you have a more serious and complex question. You lost a favorite jacket. You remember last wearing it on a bus, but on a bus trip that didn’t require you to take your wallet out. This narrows it down to day two, because the tour provided the bus as part of your pre-paid costs. Finally, you remember that you were a little tipsy the last time you remember having the jacket. Checking the distributed traces, you can see that it likely means you lost the jacket right after the vineyard visit where you had the wine-tasting.
In a similar way, distributed traces and their contextual details can be used to understand performance problems, errors or just general questions about the behavior of a request in a complex system. Perhaps you want to know whether your errors occur only when requests occur in a specific cloud provider region, or when they hit a particular database. Alternatively, you may want to understand how fast performance is for your CEO when using their iPhone compared to the average Android user.
Wrap-up
As you can see from this example, distributed trace data is a powerful tool for triaging and understanding root cause in your environment. It can help answer questions that would otherwise be nearly impossible to uncover. Distributed traces play an important role in the three phases of observability. Learn more about Chronosphere and the three phases of observability here.


