Welcome to our September 2024 feature roundup at Chronosphere! This month, we’re excited to share several new enhancements designed to improve your experience with the platform. From an AWS Metrics Streams integration to new features in the Trace Explorer, and cumulative duration analysis, these updates are focused on streamlining your workflows and helping you gain deeper observability insights. Whether you’re optimizing resource management or managing trace data, these features aim to make your platform experience more efficient and intuitive.
Chronosphere Observability Platform
Now Available: AWS CloudWatch Metrics Streams Integration
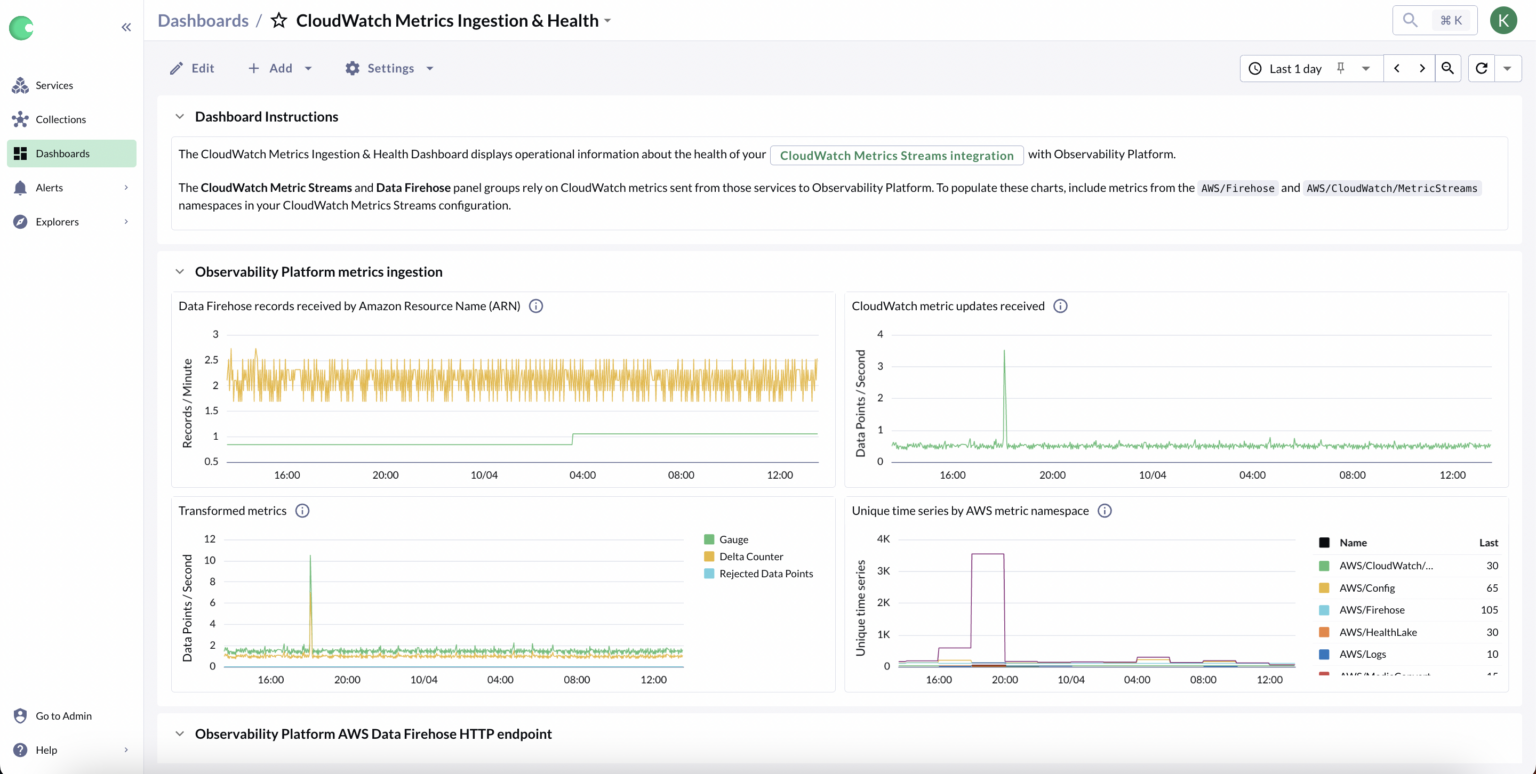
Chronosphere has introduced AWS CloudWatch Metrics Streams integration, allowing users to stream CloudWatch metrics directly into Chronosphere without additional infrastructure. This update simplifies the process of sending AWS metrics to Chronosphere by using an easy-to-configure stream, either through Terraform or manually via the AWS Management Console. Once set up, metrics are pushed every 60 seconds for real-time visibility and alerting.
This integration is particularly beneficial for organizations looking to consolidate cloud provider metrics and application data in one place. By eliminating infrastructure overhead and reducing delays, customers can achieve faster, more reliable monitoring of AWS services. The new CloudWatch Metrics Ingestion & Health Dashboard also shows key operational indicators to ensure smooth setup.
Now Available: Fixed Allocation for Pool Configuration
Chronosphere now allows users to configure fixed allocations for data point pools, providing more control and flexibility over resource management. Previously, pool allocations were expressed only as percentages, which required constant recalculations when overall capacity changed. With this update, users can specify fixed data points per second (DPPS) for pools using the new fixed_value field in the Quotas API, ensuring consistent resource allocation regardless of capacity changes.
By allowing fixed DPPS allocations, Chronosphere ensures that users can maintain stable allocations across different pools without the need for ongoing manual recalculations. This new option streamlines resource management and simplifies quota configuration for standard and histogram metrics.
Now Available: Highlight Services Transitions in Trace Detail View
Chronosphere has introduced a new enhancement to the Trace Explorer that allows users to visually differentiate service boundaries within traces. Users can now highlight specific services with distinct colors, making it easier to scan trace data and identify transitions between services. This visual aid simplifies the process of pinpointing where potential issues or bottlenecks may arise across different services in a trace.
Now Available: Allow Time Series with Empty Label Values
Chronosphere now supports the ingestion of time series with empty label values, a significant improvement for customers using OpenTelemetry. Previously, time series with empty labels were rejected, causing ingestion failures and requiring complex configuration adjustments. With this update, Chronosphere automatically drops labels with empty values at ingestion, allowing these time series to be processed without customer intervention.
This change simplifies onboarding and reduces configuration overhead for OpenTelemetry users. By automatically handling empty label values, Chronosphere eliminates the need for manual troubleshooting and configuration, improving overall usability and efficiency.
Now Available: Chronosphere Collector v0.108.0
Chronosphere Collector v0.108.0 introduces important updates, including new meta labels for Kubernetes discovery jobs and significant performance fixes. These enhancements align with Prometheus Operator behavior, allowing customers to manage scraping behavior more effectively, especially during pod terminations. The release also improves service discovery within Kubernetes by defaulting to services within the same namespace, with an option to expand across namespaces.
In addition, this update resolves several customer-reported issues related to high utilization crashes and memory consumption during Prometheus scrape jobs. Security has also been further improved with CVE remediations across critical and high-risk vulnerabilities.
Now Available: Cumulative Duration in the Trace Explorer
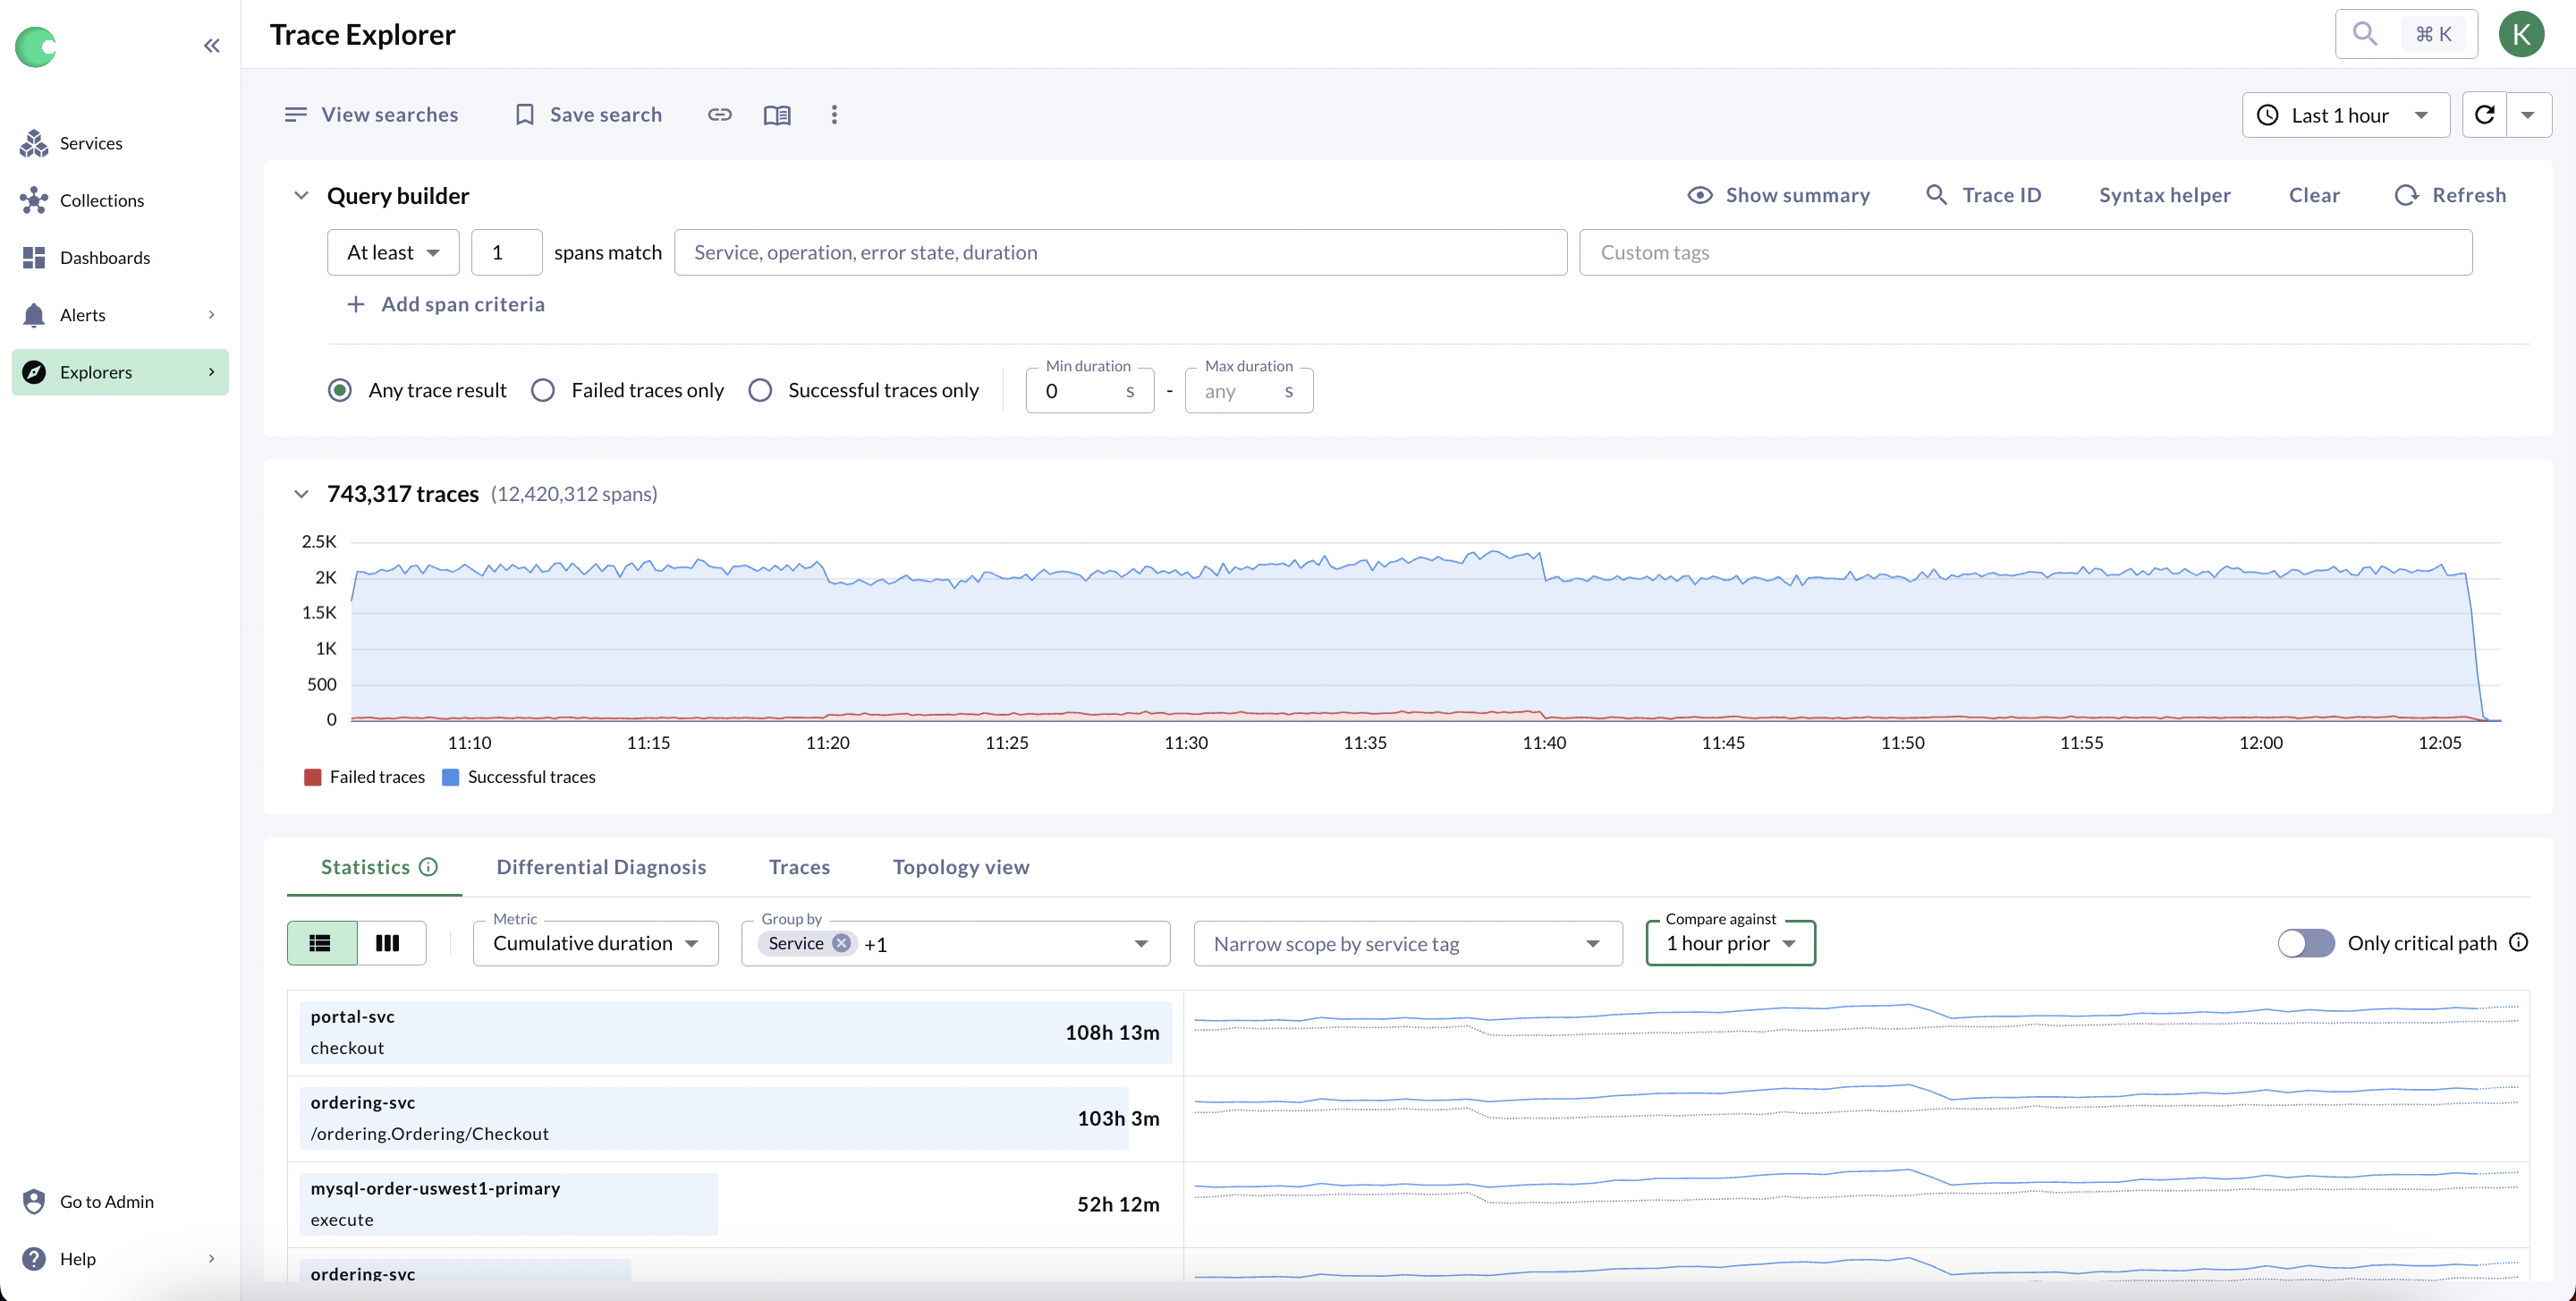
The Chronosphere Trace Explorer now includes the ability to analyze traces by Cumulative Duration, providing a deeper look into where requests are spending the most time across an entire system. This helps users uncover performance bottlenecks by showing which repetitive operations or parts of the stack consume the most time overall. This also allows users to better prioritize optimization efforts based on the cumulative impact on system performance, rather than just focusing on individual request latency.
This feature is particularly useful for identifying inefficiencies and areas for improvement at a broader system level. Users can toggle “Only critical path” to pinpoint the most time-intensive operations and compare performance over time, making it easier to detect trends or sudden spikes in cumulative latency. With this information, teams can make informed decisions about where to focus optimization efforts to improve the overall efficiency of their applications.
Now Available: Usage Analyzer Public API
Chronosphere has introduced the Usage Analyzer Public API, allowing customers to access utility score data for metrics and labels programmatically. Previously, this data was only available through the Usage Analyzer UI, which limited its flexibility. With the API, users can now retrieve utility scores, filter by metric and label names, and perform more detailed analyses using custom time ranges. This feature also supports pagination, sorting, and glob name filtering, giving customers more control over their data usage insights.
This new capability is particularly valuable for organizations looking to automate processes or integrate observability data into their existing workflows. By providing programmatic access, Chronosphere ensures that users have greater flexibility in how they analyze and manage their observability data without being confined to the UI.
Now Available: Improved Quotas Experience for Matched Write
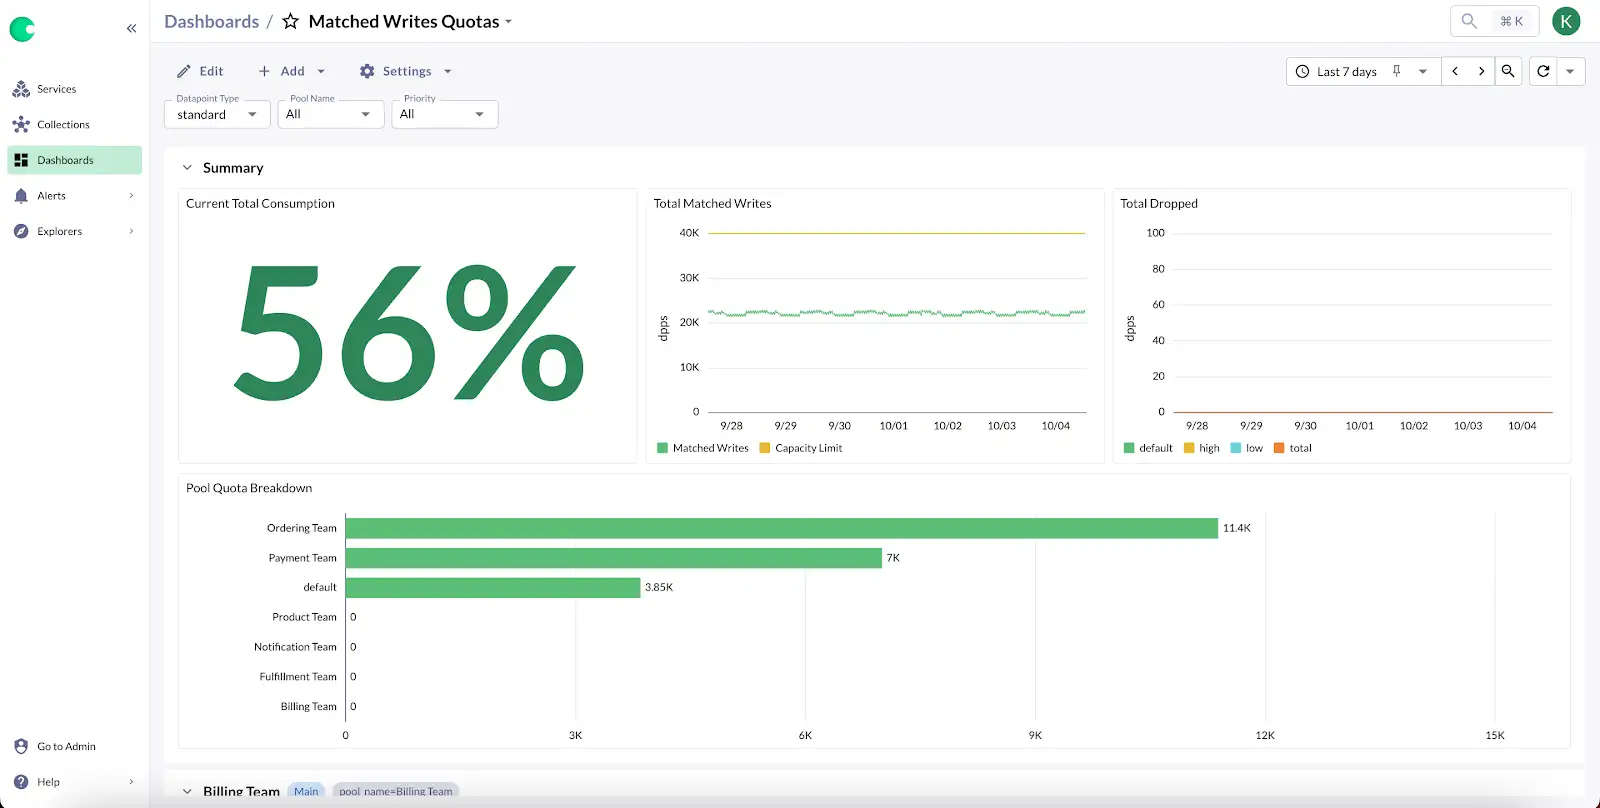
Chronosphere has introduced an improved quotas experience for Matched Writes, providing users with better control and visibility over their resource usage. This update allows customers to configure custom data point per second (DPPS) allocations for Matched Writes in their pool configurations, previously only available for Persisted Writes. In addition, a new Matched Writes Quotas dashboard offers insights into per-pool consumption and dropped data based on priority levels. This helps users track and optimize their resource allocations more effectively.
This enhancement benefits users by offering more granular control over how resources are allocated and consumed, especially when dealing with data overages. With clearer visibility into consumption patterns and drops, users can make sure their systems are efficient and within their licensed limits. This will avoid any performance degradation or unexpected drops in data.
Now Available: Send Resolved on Muted Monitors
Chronosphere has improved muting behavior for monitors, ensuring that resolve notifications are no longer suppressed when monitors are muted. Previously, when an on-call engineer muted an alert during incident resolution, the resolve notifications were suppressed. This required manual intervention to close the incident. This would also lead to confusion and repeated alerts.
This feature is particularly helpful for reducing on-call fatigue and simplifying the workflow for engineers during incident management. By automating resolve notifications for muted monitors, teams can focus on resolving incidents without worrying about manual cleanup or unnecessary repaging. This leads to clearer, more efficient communication during emergencies.
As we wrap up this month’s feature roundup, we’re excited to share these latest enhancements aimed at improving your Chronosphere experience. From enhanced resource management with Matched Writes quotas to improvements in trace analysis and notifications, each update is designed to help you optimize workflows and streamline incident management. We’re committed to evolving our platform to better serve your needs and ensure that your observability processes are efficient and reliable. Stay tuned for more updates as we continue to push the boundaries of what’s possible in cloud native observability.


