Welcome to our October 2024 feature roundup at Chronosphere! This month, we’re excited to highlight new updates across the platform designed to make tracing, querying, and observability more flexible and efficient. From enhancements to the Trace Explorer’s query builder and new dashboard integrations, to the introduction of Custom Behaviors for tailored trace control, these updates aim to improve how you work with observability data. Dive in to see how these features can simplify your workflows and accelerate your time to remediation.
Chronosphere Observability Platform
Now Available: Events are now integrated into Trace Explorer
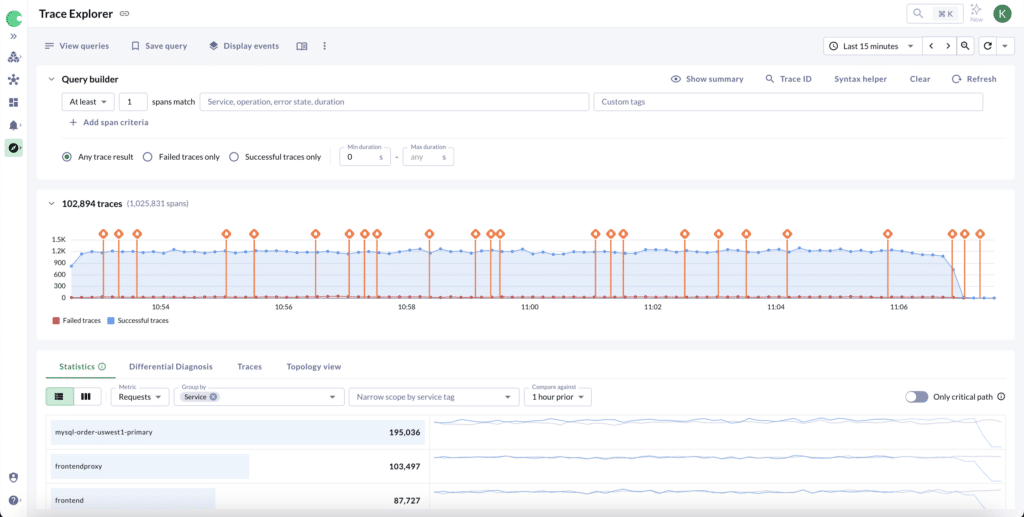
Chronosphere’s new integration between Events and the Trace Explorer lets users view relevant events directly on their trace timelines, which adds valuable context to trace data. With a new “Display Events” button in Trace Explorer, users can easily overlay events, such as deployments or alerts, onto the trace timeline. This feature is available with no additional configuration to all users of both Tracing and Events.
This integration helps users quickly investigate changes in performance by pinpointing traces during specific events, like performance tests or recent deployments. For example, responders can now analyze how a recent code deployment might correlate with a spike in latency or errors. The added context simplifies performance comparisons, which allows users to focus on traces before, during, and after key events for deeper analysis.
Now Available: Services & Collections ownership management UI
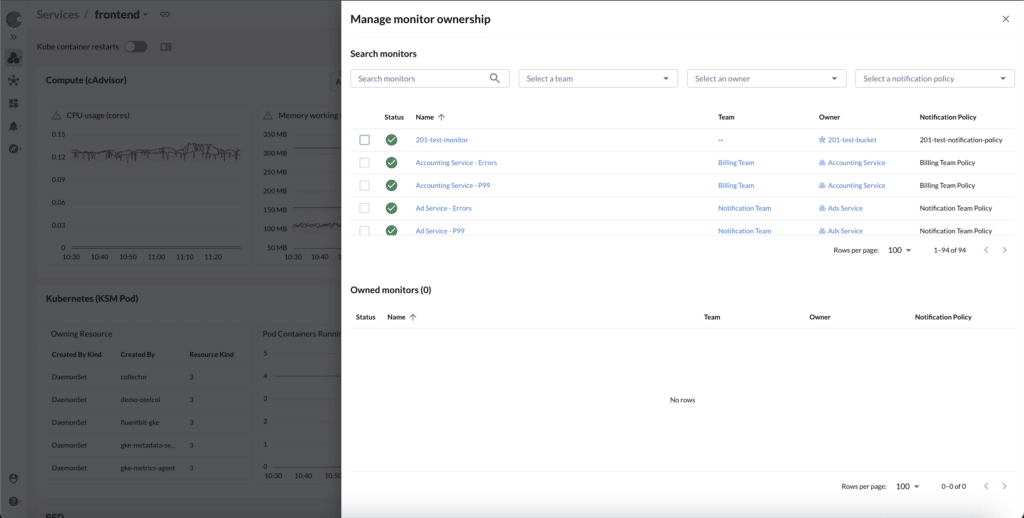
Chronosphere has introduced a new UI that allows users to assign bulk ownership of dashboards and monitors to specific services or collections. Previously, this process required manual, one-by-one assignment or automation through Terraform, making it time-consuming and complex. With the updated UI, users can now assign ownership of multiple dashboards and monitors directly from a service or collection view.
This update improves the visibility of service health by consolidating related dashboards and monitors under the appropriate service or collection. Users can now see at a glance the status of all monitors associated with a service, categorized by critical, warning, OK, or muted status. Additionally, connections to monitors can now display alert statuses without impacting the service’s health status, offering flexible monitoring for dependencies. This update streamlines the process of managing and monitoring service health, helping teams organize resources more efficiently.
Now Available: Query Traces from a Dashboard
Chronosphere has introduced a feature that makes it easier to find relevant traces directly from within a Chronosphere standard dashboard. With this feature, users can add a “Query Traces” button to any Chronosphere dashboard that allows them to pull a trace search and details drawer right on the dashboard page. This provides direct access to trace details without needing to navigate away to the Trace Explorer, which helps users diagnose issues like latency spikes more efficiently.
This integration is particularly useful when troubleshooting performance issues. For instance, if you notice a latency spike on a service, you can use this feature to instantly query relevant traces (such as those related to a service you own) and filter them by error rates, duration, or other criteria. Adding this feature is simple—just go to Settings, General, and enable the Tracing Context tag to start streamlining your trace queries from any dashboard.
Now Available: Updates to the Trace Explorer query builder
Chronosphere’s latest updates to the Trace Explorer query builder enhance usability and make it easier to find the trace data you need. Now, the service/operation field features a drop-down selector and autocomplete functionality, similar to what’s available in custom tag searches. This update helps you quickly locate and select the exact service or operation you want, which simplifies the query-building process and makes it more accessible for those new to tracing.
You can now also perform OR searches within specific tag values, making it simpler to locate traces across multiple tag options. For instance, you can query traces where the root_operation is one of several specified values, like production, prod-1, or pr-live-bravo. This is especially helpful for environments with multiple naming conventions, and allows you to capture all relevant traces across variations without needing separate queries. Together, these updates make Trace Explorer’s query builder more flexible and user-friendly.
Now Available: Custom Trace Control Behaviors
Chronosphere is introducing Custom Behaviors for Trace Control. This allows users to tailor sampling strategies to specific trace data needs, such as SEV responses or datasets with varying priority levels. Previously, users could apply system-default trace behaviors like “Allow,” “Deny,” or a Baseline sampling behavior that emphasized errors. With Custom Behaviors, you can now copy a baseline behavior as a template and adjust settings to better match your needs. For example, you can create a custom behavior to prioritize high-severity errors by sampling errors and successes at different rates or focus on long-duration traces.
This feature gives teams more flexibility in managing trace data by setting custom criteria for sampling rates. By supporting a more customized approach to trace sampling, Chronosphere helps users adapt their observability strategy to various operational needs, which improves both resource efficiency and data relevance.
As we wrap up this month’s feature roundup, we’re excited to have these latest updates bring more flexibility and ease to your work with the Chronosphere Observability Platform. From simpler trace analysis to more control over trace sampling, each feature is built to support smoother workflows and more controlled observability. We’ll keep working to make the platform as efficient and useful as possible, so stay tuned for what’s next in observability!


