TL;DR
Logs get noisy fast. Pods churn, sidecars chat, retries loop. During an incident your team ends up sifting through pages of logs trying to identify meaningful data. You shouldn’t have to craft the perfect query to find the data you need.
That’s why we added Patterns to Chronosphere Logs – a simpler way to interpret your log data.
The Patterns feature groups repetitive log lines by their shared structure. So, you can see the shapes of your data first, then focus on the entries that are showing unusual behavior. It surfaces meaningful data without guesswork.
How Patterns works
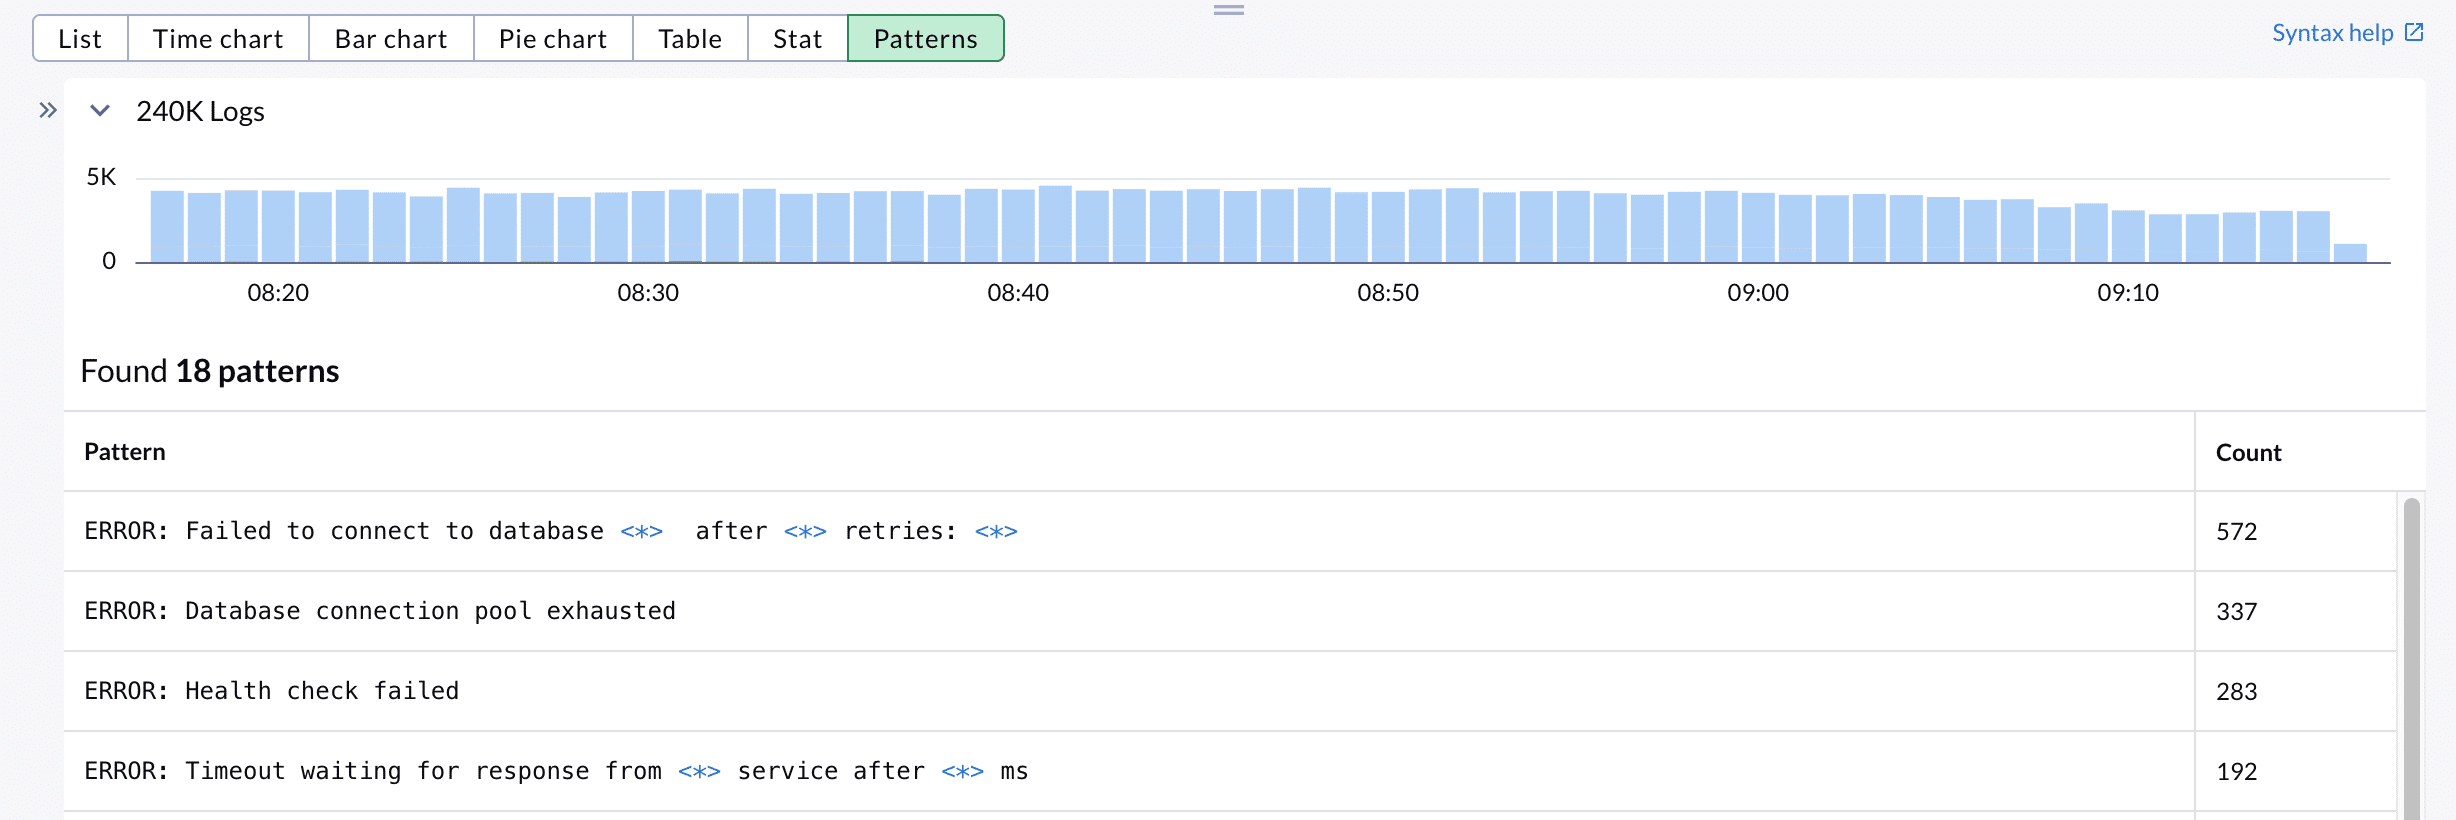
Open Logs Explorer and start the way you usually do: filter by service, severity, namespace, or any attribute your team cares about. Then click Patterns.
From there, Chronosphere clusters logs that share the same structure and abstracts the variables – IDs, IPs, pod names – so you can scan the big picture. If you spot something interesting, click Show Matching Logs to jump back into full-fidelity entries for that pattern. If a bucket is just background chatter, Hide Logs to keep the view clean while you investigate.
Now you can easily see: what’s normal, what’s new, and what just spiked in one namespace but not the others. You go straight from “something’s wrong” to “this is the new error message that appeared right before the burst of 500s.”
What’s under the hood?
Patterns groups together similar loglines. Consider the following data:
`2024-06-11 10:23:45 INFO User 12345 logged in from 192.168.1.100
2024-06-11 10:24:12 INFO User 67890 logged in from 10.0.0.50`
These belong to the same pattern. The timestamp, level, and phrase are constant; the user ID and IP are variables. By grouping at this level, your team navigates by type of event rather than drowning in tiny differences. That’s why anomalies stand out, and that’s why it’s faster to connect a new message shape to a specific deploy, pod, or node.
Patterns also powers Usage Analysis
Patterns doesn’t stop at troubleshooting – it’s the foundation of our Usage Analysis feature, which offers quantified insights into how valuable your logs are to your engineers and recommends ways to reduce log volume safely.
Here’s the flow:
- Chronosphere analyzes every incoming log entry and groups it into a pattern that captures the structure while abstracting variables.
- Each pattern receives a Utility Score based on real usage across your workflows – searches, dashboards, alerts, and how often teams rely on that pattern.
- With utility measured at the right level (pattern, not individual lines), we provide recommendations to reduce data volume without losing what your team needs.
Instead of blanket sampling or risky drops, you make precise calls: keep high-utility patterns at full fidelity; consider downsampling or filtering low-utility logs. As a result, costs go down and signals go up.
Try Patterns in Chronosphere today
Patterns brings structure to the most unstructured part of your observability stack. It helps your team see what’s new, what’s normal, and what to do next. To access, open Logs Explorer, filter to your liking, and click Patterns.
Ready to Go Deeper?
Check out Chronosphere Logs and see how we help platform teams move faster with less noise