

For many companies, understanding trends is important for maintaining and growing their business, and one of the ways to do this is by monitoring metrics over time. Metrics monitoring not only provides insight into the current state of a business, but with the ability to examine metrics week over week (WoW), companies can quickly understand whether or not a metric is performing as expected and in line with previous behavior.
In this blog, we will discuss how we worked with a delivery app company to develop and add new functionality – known as comparison mode – to Chronosphere to allow for WoW views of metrics. With comparison mode, this delivery app company is able to customize their dashboards for their various use cases and metrics to continue monitoring metrics over time, ensuring that these metrics are in line with previously recorded and expected performance.
Designing and building comparison mode
Before comparison mode, there was no easy way to view historical metrics data alongside real-time metrics in a single graph. The idea for this capability came from one or our customers — a delivery app company. Given how cyclical their business is, the company relied heavily on historical data to understand whether their current or real-time metrics are performing as expected. Just looking at a chart or graph in a vacuum couldn’t give them the context they needed. For example, if a metric spikes on a Friday afternoon, is there an issue? Or has that metric spiked every Friday afternoon for the past several weeks. Without a built-in feature, teams had to make manual changes to graphs panel by panel, which was time consuming.
Understanding the need for an automated and simplified solution, we worked with the delivery app company to develop a proof of concept to allow them to view current and offset metrics alongside each other in a single panel. (Note: we are using “offset metrics” to refer to the historic metrics data that are offset by a particular time period (i.e. by one week ago or one day ago) for comparison over time purposes.)
How comparison mode works
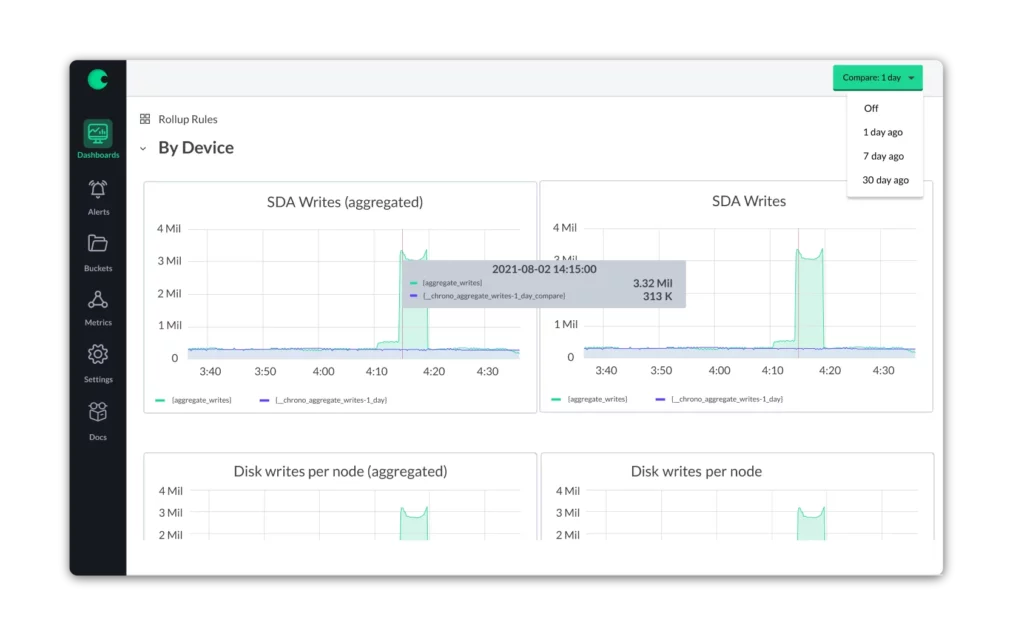
In terms of the design, we implemented a toggle to automatically enable comparison mode — you can choose to do a day-over-day, week-over-week, or month-over-month comparison. When turned on, this feature will intercept queries accordingly so that two queries are created per request – one for the current time series and one for the offset time series. From there, the two queries are matched together via tag logic where “_offset_:true” on the offset query and “_series_:series<num>” on all the series to ensure the same number is given to the same series so they can be colored similarly. See the below for example tags for the original and offset series:
"__chrono_offset__": "offset_1d"

"__chrono_series__": "series0"
But from the user perspective it’s simple, click on the “compare” button and select your time period: 1 day, 7 days, 30 days. Chronosphere will add the historical time series to your graph so you can easily compare the current data to the historical. While this might sound simple, it’s saved our customers hundreds of hours of manual work and helped them more quickly triage issues.
What’s next for comparison mode?
Since comparison mode was launched back in March, the delivery app company has made significant time and efficiency gains when wanting to compare metrics over a period of time. Not only is it faster to view and compare metrics within Chronosphere, but it’s also easier to identify and understand WoW trends by consolidating both queries in a single panel.
In terms of next steps, some additional capabilities we’re considering include adding alerting functionality to automatically signal any unexpected behavior or metric values and ensure reported values are within an acceptable range.
At Chronosphere, we are building a Prometheus-native metrics monitoring solution built for massive scale. If you’re interested in learning more, please reach out to [email protected] or request a demo.


