

This post is a version of a talk I recently delivered at Monitorama 2022 in Portland.
I was recently at KubeCon EU in Valencia, and it amazed me that projects like Kubernetes have become such an essential part of many application stacks that it’s hard for many large teams to imagine building anything without it.
Surveying the landscape
It also struck me that some projects such as Kubernetes (add to this many common programming languages and other tools) have equally become so complex, that we need to add dozens of other tools and dependencies to use them effectively. There were so many sponsors, exhibitors, and companies involved with KubeCon EU it took me around 15 seconds to scroll through the whole list.
Similarly, the infamous Cloud Native Computing Foundation (CNCF) landscape image has become so large you need to zoom out to see it all at once. There is a special interest group now tasked with making the landscape easier to navigate.
After a long era of (relatively) affordable cloud computing resources, there has been a temptation to keep throwing more cloud-based resources at problems. There was minimal impact on cost, and we gained a lot of advantage from the flexibility offered.
We didn’t want to write boilerplate code repeatedly, so we used frameworks and dependencies to (hopefully) help focus on “what was really important.”
We needed tools to handle demand, test and build applications, orchestrate infrastructure, run continuous processes, etc and etc and etc…
Because of all this abstraction, we lost direct insights into our technical stacks and what was happening inside applications. We added more and more tools to help us understand what we had lost sight of. This includes observability, but there are also concentrated efforts within the CNCF and other foundations to help bring clarity to the security risks introduced through nests of dependencies, such as software bills of materials.
Currently, for a handful of different reasons, the financial impact of this growth of cloud services is now starting to hit budgets, with a growth of tools to help estimate, monitor, and streamline costs. There’s even an entire sub-foundation of the Linux Foundation, the FinOps foundation, that aims to help increase skills and awareness of techniques and practices around efficient cloud usage.
Investigating further with the Cloud Carbon Footprint project
In preparation for the talk version of this article, I spoke with Adrian Cockroft, who had a talk at Monitorama along similar themes. He mentioned the Cloud Carbon Footprint project as a useful tool for measuring the estimated carbon footprint of applications and the infrastructure they run on.
The project requires some configuration and provides insights into AWS, GCP, and Azure hosted resources by analyzing billing data and performing emission calculations on them. That calculation is the following:
Total CO2e = operational emissions + embodied Emissions
- Operational emissions = (Cloud provider service usage) x (Cloud energy conversion factors kWh) x (Cloud provider Power Usage Effectiveness (PUE)) x (grid emissions factors metric tons CO2e)
- Embodied Emissions = estimated metric tons CO2e emissions from the manufacturing of datacenter servers, for compute usage
The project is open source, so you can add other providers or input from elsewhere. It’s maintained primarily by Thoughtworks, and of course (a recurring theme here), as a complex application, it has its own overhead and impact. But you have to start somewhere, and for now, it’s a good starting point.
To begin, run with the mock data, which you can do by first cloning the repository and installing dependencies.
git clone –branch latest https://github.com/cloud-carbon-footprint/cloud-carbon-footprint.git
cd cloud-carbon-footprint
yarn install
yarn start-with-mock-data
UI overview
The UI consists of a handful of key areas:
- Filters for providers, accounts, services, and dates.
- Usage over time with a summary of metric tons, KWh, and cost.
- What emissions equal compared to flights, phone charges, and trees required to sequester the carbon.
- Emission break down by service, region, and account.
- Regional intensity map by provider.
Monitoring an application
To set up cloud carbon footprint to measure your applications, you can manually edit the .env files in api and cli folders or run the yarn guided-install command to configure with a wizard. I used GCP for the test application.
As evaluating the carbon footprint of applications typically needs to happen over a longer period and building a sufficiently complex application also takes time, I opted to build something simple, increase its complexity gradually, and then multiply and extrapolate the impact by assuming that the application would have about 1000 concurrent users most of the time over the space of a year. I simulated the user load for brief bursts of time with JMeter.
I used EU-based servers, mostly as that’s the region I am based. I knew that the application would use GCP cloud run, cloud SQL, and all the other ancillary services they would need, including big table, artifact registry, and billing. This already shows that a simple application can start pulling in a handful of other indirect services. There is a GitHub repository with all the code you will need to setup a SQL database and table.
- I started with an obligatory “hello world” application written in JavaScript that outputs “hello world” to console.
- I then added Express JS, that instead outputs “hello world” when visiting a specific endpoint.
- I then added a database, cloud SQL in this case, that instead loaded three rows from a table and output those when loading the endpoint. It also checked for a correctly set API key in the URL arguments.
- I finally added intentional processing complexity, which took the form of a large
forloop.
Application impact
The graph below shows my results, but these values are before multiplying them with my assumptions.
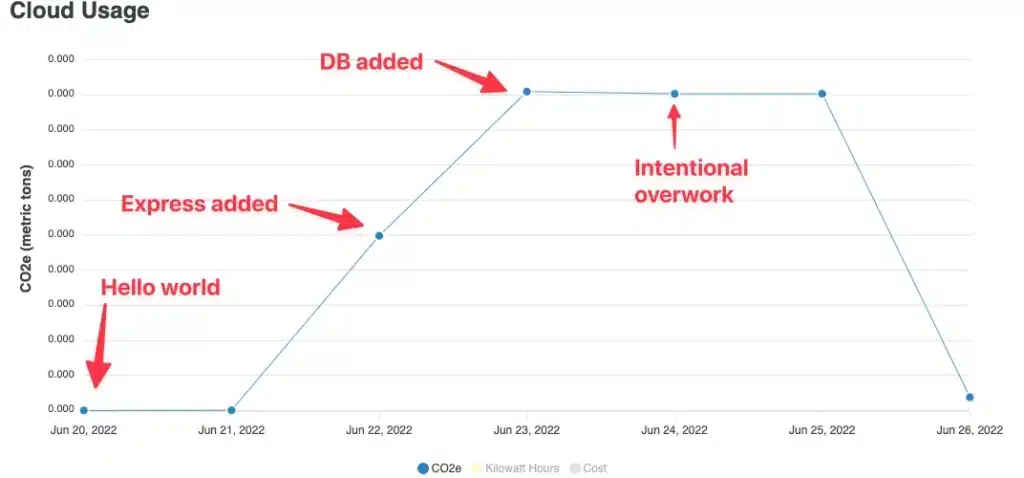
The basic hello world application has minimal impact. It jumps up after adding Express. Jumps up more when adding SQL, and the large for loop actually added little, which surprised me. Another surprise was that the impact didn’t then jump down to zero afterward, I guess the SQL service used resources when idle.
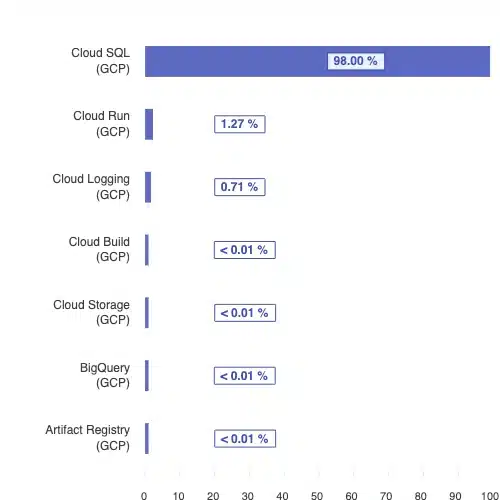
On the subject of Cloud SQL, it was by far the largest consumer of resources, accounting for around 98% of the total impact. This shouldn’t have surprised me, but it did. The application had no caching or SQL optimization, but was doing little.
Then multiplying the values measured, my application, when running at peak, would have the following equivalent impacts:
- 1 one way flight from London to NYC
- 140,000 phone charges
- 20 seedlings grown for ten years to sequester the emissions
These numbers don’t sound that high, but remember, this was a simple application. Multiply them by the many, many, many applications running out there, and you start to see how things can add up.
What can you do?
I have never been one that liked blog posts that told me about a bunch of problems but didn’t give any advice on what I could do about them. Here goes.
You can help by streamlining and thinking about inefficient services.
Good news! If you’re reading this, you likely have an interest in observability, and are probably already doing this, know how to do this, or want to learn how to do this. Many of the tools in the observability ecosystem also help with environmental impact. An inefficient service is quite often the source of the bigger impact.
You can think about compiling code or using a compiled language for certain services. If you haven’t already, look into updating dependencies that may contain memory leaks or efficiency gains.
Think about application features that directly or indirectly affect impact. For example, Chronosphere has features that help customers streamline the metrics they store. This reduces all sorts of overheads but also reduces the impact on our cloud services.
Finally, regularly undertake audits of cloud resources and consider automated tooling to help with this. Resources you don’t need impact the environment in addition to wasting money.
Think broader
Not all cloud vendors are equal, and some are better at providing tools and options for running greener services. Equally, certain locations are greener and have a better power usage efficiency (PUE) than others. If you can choose, then use data centers with a lesser impact. Location is also important for impact efficiency. Using data centers closer to users reduces the carbon emissions of transmitting that data around the globe. Similarly, using well-located CDNs not only helps with application speed for users but again reduces the impact due to shorter transmission times and lengths.
I was pleasantly surprised to see that all the three major cloud providers now have sustainability tooling (I couldn’t test GCPs as it needed the application to be running for over a month to get meaningful data). Google even recently hosted an entire event about sustainable cloud.
Don't forget the frontend
The front end is an essential part of many applications and hopefully already part of your observability stack, as the front end doesn’t just affect you and your costs or environmental impact but also those of the user. Take all those impacts mentioned earlier and multiply them by a large and hard-to-define quantity as end users run your frontend code on their machines. We all know and joke about how browsers and modern web applications impact machine performance. That performance hit has an additional environmental impact.
Fortunately, the front-end community is already thinking about this and has been for a little while. Here are the best links I found to get you started:
Get ahead and think broader
I feel that certain jurisdictions (for example, the European Union) may soon start mandating impact audits of websites and services. Audits might start becoming more common, much like software bills of materials. As with many cases of regulation, it often pays to get ahead of it and even help influence the form it may take.
Ask your vendors for impact reports, and provide yours to customers. They show you care about things beyond your bottom line and can give you a competitive advantage.
Observability already provides us with the tools needed to analyze the impact of applications. We can build dashboards and other monitoring features to start monitoring now. So, why not?


