
The challenge: Setting up alerts is time consuming
We are excited to announce Chronosphere Alert Monitors designed to give users more flexibility with alerts and makes them easier to create and manage. This post provides details of how Alert Monitors help your organization gain insights into your alerts while saving time and reduce the potential for errors.
You’re on the observability team at your company, and you just received word that a new service is launching. It’s an important service that interacts with other key services and has both dependencies and depends on many other services. In addition to the production environment, the service will be deployed in your two development environments, your test and pre-production environments.
This situation probably sounds familiar. As more and more companies continue their march toward a distributed microservices architecture it will become the norm for observability teams. According to a recent survey from 451 Research, two-thirds of respondents said that more than half of their devops applications are deployed as cloud-native (451 Research’s Voice of the Enterprise: DevOps, Workloads & Key Projects 2021).
After instrumentation, it’s time to get metrics and alerts set up for the new service. Engineering management wants to be sure latency under load doesn’t become a problem with the new service, so you create a Monitor that will result in a critical alert notification if latency of requests exceeds 50ms for more than 30 seconds. And it’s here where you breathe a sigh of relief. To get coverage across production, pre-production, test and development environments you only need to perform one task that will apply to all your environments and scenarios.
In your old monitoring system you would have been forced to write dozens of unique rules, one alert rule for a specific threshold for production, you had to go back and write the same rule again with a couple of small changes for each environment and severity level. For example, change the environment variable to ‘pre-production’ and the notification to ‘warning’. This had to be repeated over and over for each of the environments in which the new service is being deployed. Not only did this take a lot of time, there was always the chance that you would mistype a variable that would cause an error. Maybe worst of all, you were adding to what was already an unmanageably long manifest of alert rules.
Fortunately, Chronosphere recently announced a new capability called Alert Monitors, which is a significant upgrade over legacy alert rules. Monitors make your life easier by reducing the time and complexity associated with configuring and managing alerts. Perhaps most importantly, there are fewer human-introduced errors as a result.
So what are Chronosphere Alert Monitors and how do they work?
We’ll go through all of the details but the tl;dr is Alert Monitors query time series and optionally group the results into signals. When those time series violate conditions, an alert is triggered and a notification is sent (which can be muted).
So let’s go through the concepts introduced in the above sentence in some detail.
Important concepts to understand:
A Time Series is a related collection of individual data points. Each data point consists of a float value, a set of labels, and a timestamp (the moment the datapoint was emitted). Every data point in a single time series has the same labels.
Monitors are configured to watch time series data as specified in the Monitor query. The results of a Monitor query can either be time series data, or the outcome of some function applied to time series data.
Signals are optional groupings (by label) of the results returned from the Monitor query. For example, you may want to group time series from multiple environments (e.g. development, staging, production) in order to be alerted separately for each environment.
Conditions are tests against which the results of a Monitor query are evaluated, and a related severity (e.g. critical or warning). An example of a condition would be testing whether a time series value remains greater than 1 for a duration of 30 seconds, and then specifying whether that violation constitutes a critical or warning alert.
Alerts are triggered when one or more Monitor query results violate a condition. If signals are configured to group the Monitor query results, an alert is generated for each signal that violates a condition.
Notifications are sent to specified endpoints (PagerDuty, email, Slack, etc) when an alert is triggered, and optionally when the alert is resolved. Notifications are configured in a notification policy.
Muting Rules temporarily suppress notifications for a triggered alert. Muting rules can apply to a specific alert, to the Monitor or signal that generated the alert, or to any stored time series in your system.
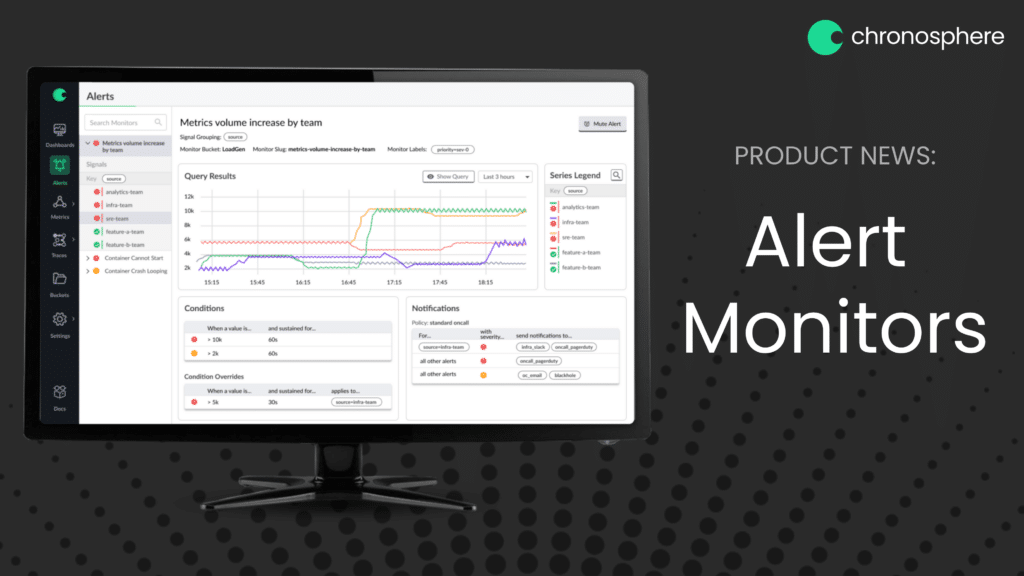
Viewing Monitors in the UI
After you have everything configured, you want to understand what you’re seeing in the application. Fortunately, viewing and interacting with Monitors in the UI is easy and intuitive.
The first thing you will notice in the list is which Monitors are alerting with either a critical (red exclamation point) or warning (yellow exclamation point) icon.
Selecting a Monitor from the list will show the details on the right. You can search monitors as well as filter them to only see the ones in a critical or warning state or the Monitors assigned to a specific Bucket (organizational groupings of Monitors, dashboards, and metrics).
As described above, Signals are a way to group the results returned from a Monitor query by specific labels. In our example of a new service launch the observability team might choose to group signals by environment (e.g production, pre-production, test and development) so there is a logical grouping of alerts and an issue in a development environment can be separated from an alert in the production environment.
Viewing Monitors using the command line
You can use chronoctl to return a YAML list of all Monitors with chronoctl get Monitors or an individual Monitor by specifying the slug or name with the –slug or –name argument, respectively.
Next steps with Alert Monitors
Monitors are simple but very powerful. In particular they make administration of alerts across complex environments easy to set up and manage. For users, the Monitors page of the UI is your one-stop place to view and interact with alerts. Several Chronosphere customers have multi-tenant environments where they monitor infrastructure on behalf of their customers. Monitors makes adding alerts for each of their new customers and ongoing management has become a much smaller effort because of Monitors.
We are very excited to introduce Monitors and the feedback from our customers has been overwhelmingly positive. But we are not done. We will introduce additional Monitor functionality to make managing alerts simpler and easier while adding more features.


